
Crypto Bull Run 2026: 5 Signals Prediction Markets Are Pricing Right Now
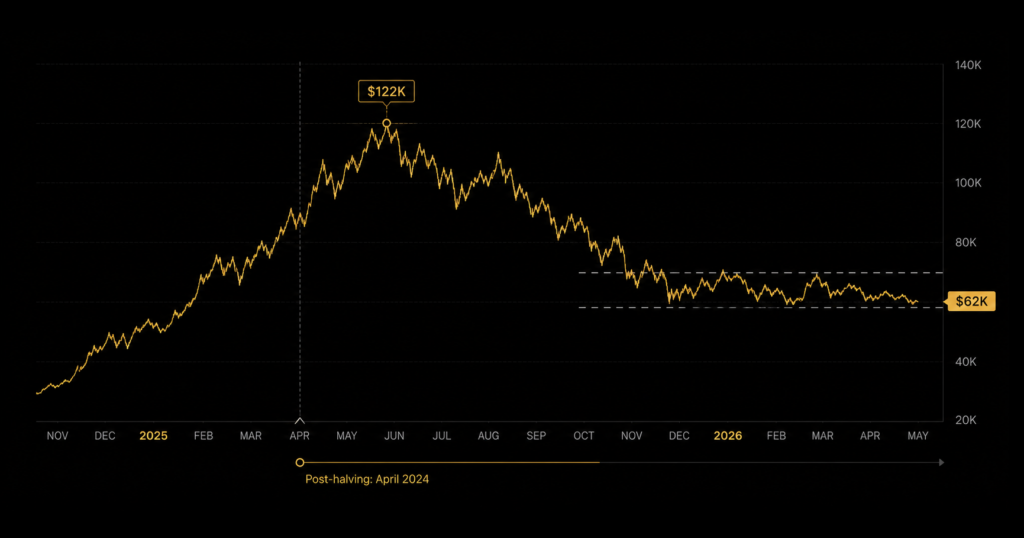
Bitcoin hit $122,000 in 2025. Then it didn’t stay there.
By mid-2026, BTC is trading in the $60,000-$65,000 range. Total crypto market cap sits around $2.16 trillion, below the $3 trillion peak. The CMC Altcoin Season Index is at 46, firmly Bitcoin Season territory. Fear and Greed readings have recovered from recent lows but haven’t broken through to sustained greed.
Depending on who you ask, this is either a textbook post-ATH consolidation phase or the beginning of a longer correction. Prediction markets have a view. It’s more precise than analyst commentary, and it’s visible in real time.
That’s true for crypto markets. It’s equally true for the sports, esports, and political markets that sit alongside BTC price contracts on the same platform. Polymarket is one order book. DG3 is the terminal that reads it across every category simultaneously and understanding the crypto market structure is part of understanding how capital moves across the whole thing.
Table of Contents
What Drove the Peak Before the Crypto Bull Run 2026 Consolidation
The 2024-2025 cycle had two structural drivers that previous cycles didn’t.
The first was spot Bitcoin ETFs. BlackRock’s iShares Bitcoin Trust accumulated over 773,000 BTC in its first year of operation, joined by Fidelity, Bitwise, and others. This wasn’t speculative retail flow, it was systematic institutional allocation creating a persistent demand baseline. Spot ETFs saw $1.9 billion in net inflows in the first week of 2025 alone. BlackRock logged $370.2 million in a single day.
The second was corporate Bitcoin treasury adoption at a new scale. MicroStrategy had pioneered the playbook. By 2025, it had spread: Trump Media’s $2.5 billion Bitcoin investment, Fidelity’s direct purchase programs, and a growing list of mid-cap companies treating BTC as a reserve asset rather than a speculative position. This capital behaves differently from hedge fund or retail exposure, it doesn’t liquidate during drawdowns to meet redemptions.
Together, these two forces pushed Bitcoin to its ATH of $122,000. The pullback to the $60,000-$65,000 range reflects a cooling of narrative momentum, a Federal Reserve that hasn’t pivoted as aggressively as some anticipated, and the natural digestion phase that follows any asset’s first run at a new price level.
What Prediction Markets Are Pricing for H2 2026
Polymarket BTC price milestone markets tell a more calibrated story than analyst price targets. Rather than “Bitcoin will hit $X by year end,” prediction market prices express a specific probability for a specific threshold by a specific date, which is a meaningfully more honest form of forecasting.
As of mid-2026, the data from active BTC milestone markets shows a market that’s cautiously constructive but far from pricing a near-term return to ATH:
Markets pricing BTC above $80,000 before year-end carry moderate probability. Markets pricing a return to $100,000+ are in the 20-35% range depending on timeframe. Markets pricing BTC below $55,000 are showing less than 15% probability, suggesting the crowd doesn’t expect a deeper correction, but isn’t aggressively buying the bull case either.
This is exactly what consolidation looks like in prediction market pricing: compressed probability distribution around a middle range, with tail scenarios in both directions discounted. Understanding how crypto event markets work, specifically the volatility modelling that underlies BTC threshold-crossing probability, is the research infrastructure that separates informed entries from directional guesses.
This volatility modelling approach isn’t exclusive to crypto. The same framework – devigged price, independent probability estimate, edge calculation is what DG3 applies to CS2 match winner markets, football outrights, and political contracts in real time through the Edge Finder. Crypto traders who learn to think in probabilities here tend to find the sports markets immediately familiar.
The Technical Picture in July 2026
Bitcoin is trading below its 50, 100, and 200-day exponential moving averages, which keeps the short-term trend structure cautious. RSI near 50 shows momentum that’s neutral rather than extended.
Key levels from a technical standpoint:
Support: $62,500 is the near-term floor. A break below risks a test of $61,377 and then the $60,000 psychological level. Below $60,000 opens $55,000-$57,000 as the next meaningful support zone.
Resistance: $64,000-$65,000 is the immediate ceiling. Reclaiming the 50-day EMA near $66,000-$68,000 would shift the short-term structure from cautious to neutral. The 200-day EMA near $70,000+ remains the key level that needs reclaiming for any sustained bull continuation.
Total market cap at $2.16 trillion is trading below the 20-day EMA ($2.33T), 50-day ($2.44T), 100-day ($2.50T), and 200-day ($2.67T) exponential averages. The market is in technical compression, which historically precedes either a flush lower or a base-building period before the next leg.
The July historical average return for Bitcoin is +7.61% with a median of +8.16%. The month has started with a +7.78% gain, consistent with the seasonal pattern.
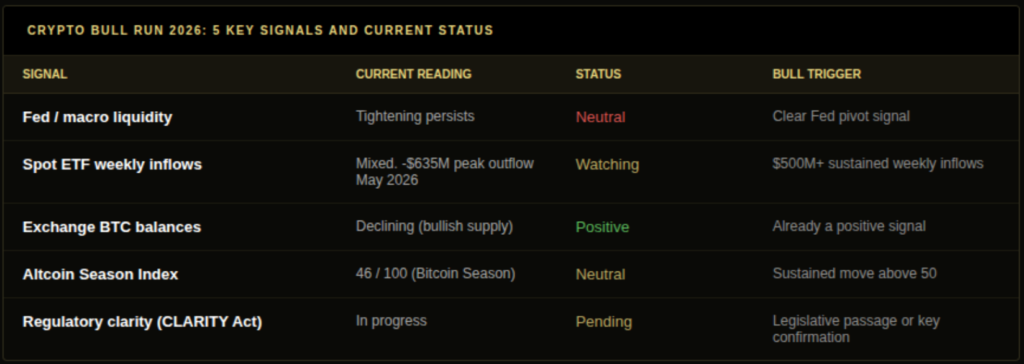
5 Signals That Determine Whether the Crypto Bull Run 2026 Continues
Most bull run commentary fixates on price targets. The underlying drivers are more specific.
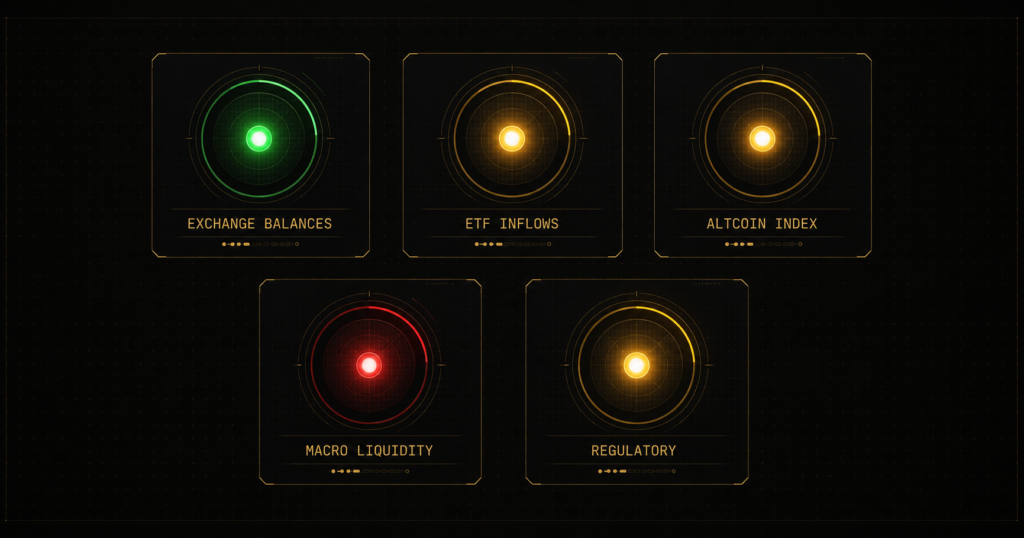
Signal 1: Macro liquidity and Federal Reserve posture. The crypto bull run thesis in 2024-2025 was partially a bet on global liquidity expansion. The Fed’s actual rate path in H2 2026, specifically whether it signals rate cuts and a return to liquidity expansion, is the most notable external variable for BTC price trajectory. Any Polymarket market on Fed decisions or rate cuts carries direct correlation to BTC price milestone markets.
Signal 2: Spot ETF inflow continuation. The structural demand argument for Bitcoin depends on ETF inflows continuing. Net outflow periods (the record $635M outflow day in May 2026 is documented) create downward pressure even against positive long-term narratives. Tracking weekly ETF flow data via SoSoValue is a leading indicator for short-term BTC price direction.
Signal 3: Exchange balance trends. Declining Bitcoin held on exchanges signals long-term holders are withdrawing to cold storage, reducing sell-side availability. Rising exchange balances signal potential distribution pressure. This on-chain signal has been a reliable leading indicator across multiple cycles.
Signal 4: Regulatory clarity developments. The CLARITY Act and other US crypto legislation in progress for H2 2026 could reduce institutional uncertainty, particularly for altcoin ETF approvals. Kalshi and Polymarket both carry active markets on specific legislative outcomes. Trading the news in event-driven prediction markets is the applicable framework here.
Signal 5: Altcoin Season Index crossing 50. The CMC Altcoin Season Index at 46 means most altcoins are still underperforming Bitcoin. Historical patterns show that when the index recovers above 50 and holds there for several weeks, capital rotation into altcoins typically follows within one quarter. The index’s yearly high of 78 in September 2025 and yearly low of 12 in April 2025 give context for the current reading. Until a sustained move above 50 occurs, Bitcoin dominance (currently at 58%) should be expected to remain elevated and most altcoin strength should be read as selective rotation rather than the start of a genuine altseason.
Top Narratives Inside the Crypto Bull Run 2026 Prediction Market Cycle
Beyond macro signals, prediction market volumes cluster around specific sector narratives. These are the ones carrying the most active positioning in mid-2026:
AI-crypto convergence. Projects building decentralised AI infrastructure have moved from speculative to operational in 2026. Prediction markets on AI token price milestones and protocol events carry growing volume as the category matures.
Real-world asset tokenisation. Tokenised T-bills, real estate, and equities are being deployed at institutional scale. Ondo Finance and Franklin Templeton’s on-chain products represent a genuine bridge between traditional finance and blockchain infrastructure. RWA protocol events are generating prediction market interest.
Solana ETF approval odds. With Galaxy, Franklin Templeton, and VanEck having filed for spot Solana ETFs, the regulatory approval timeline is a live prediction market event. If approved, it would represent the most notable altcoin market structure event since Bitcoin ETF approval.
Stablecoin infrastructure and payments. USDC, PYUSD, and the broader stablecoin ecosystem are seeing adoption by Stripe, Shopify, and reportedly Walmart for payment processing. Stablecoin-adjacent regulatory markets are among the highest-volume non-BTC crypto prediction markets in 2026. The US Stablecoin Bill, in active legislative discussion, is a defined binary event that could reprice the entire category on announcement.
Layer 2 scaling and modular chains. Optimism, Base, and Polygon continue scaling Ethereum transaction throughput while reducing fees. The narrative around L2 adoption is mature enough that individual L2 milestones now generate prediction market volume, daily active users crossing thresholds, TVL milestones, and ecosystem grant announcements are all creating tradeable binary events on Polymarket. This is the kind of development cadence that rewards traders who track the underlying protocol pipeline, not just the token price.
The Honest Read on Whether the Crypto Bull Run 2026 Is Over
Not based on what prediction markets are pricing.
What prediction markets reflect: cautious positioning, not bearish conviction. The probability distribution on BTC price contracts doesn’t show heavy money on a continued decline, it shows a market waiting for a clearer signal before committing to the next directional move.
The correlation data supports this reading. BTC’s 71% correlation with the S&P 500 and 87% correlation with Gold suggests this is a macro-driven consolidation rather than crypto-specific selling. When risk assets broadly recover, Bitcoin typically leads the recovery.
What would change the picture: a clear Fed pivot toward rate cuts, resumed spot ETF inflows above $500M weekly, Altcoin Season Index sustained above 50, and the recapture of the 200-day EMA near $70,000+. None of those have happened yet. All of them are trackable in real time through on-chain data, ETF flow reports, and prediction market pricing.
The positive EV framework for prediction markets applies here as much as anywhere: position sizing should reflect the genuine uncertainty in current pricing, not a narrative-driven conviction that the outcome is already determined.
One thing worth anchoring to: every major crypto bull run has included at least one consolidation phase that looked like the end and wasn’t. The 2021 run dropped 50% in May before continuing to ATH in November. The 2017 run had multiple 30%+ corrections within the larger uptrend. Mid-cycle consolidation at the $60,000-$65,000 level, following an ATH of $122,000, is within the historical range of normal post-peak behaviour.
Bull runs don’t announce themselves. They reveal themselves in data, over time, to the people watching the right signals. The participants positioned for the next leg are tracking ETF inflows weekly, watching the altcoin season index for sustained movement above 50, and using prediction market prices as the most honest real-time read on collective probability estimates. The terminal that surfaces those signals across crypto, sports, and esports simultaneously – ranked by EV gap in real time – is DG3. Same platform. Every market.
Frequently Asked Questions
Q: Is the crypto bull run still happening in 2026? A: Yes, though it’s in a consolidation phase rather than a parabolic leg. Bitcoin hit $122,000 in 2025 and has pulled back to $60,000-$65,000 in mid-2026. Prediction market pricing shows cautious constructive positioning rather than bearish conviction, the probability distribution on BTC price contracts doesn’t show heavy money on continued decline, but it’s not aggressively pricing a near-term ATH retest either.
Q: What signals matter most for the 2026 crypto bull run? A: Federal Reserve liquidity posture, spot Bitcoin ETF weekly inflow data, Bitcoin exchange balance trends (declining = bullish supply signal), Altcoin Season Index crossing and holding above 50, and specific regulatory developments including the CLARITY Act and potential Solana ETF approval.
Q: Will Bitcoin reach $200,000 in 2026? A: Prediction markets as of mid-2026 price this as a low-probability outcome for the year, most active BTC milestone markets show $100,000+ by year-end at 20-35% probability. Institutional forecasts are more conservative. The structural drivers (ETF baseline bid, corporate treasury demand, post-halving supply reduction) support the long-term bull case, but the timing within 2026 is highly uncertain.
Q: What is Bitcoin dominance in 2026? A: Bitcoin dominance is approximately 58% as of July 2026, firmly in Bitcoin Season territory. The CMC Altcoin Season Index sits at 46, below the 50 neutral mark and well below the 75 threshold that defines genuine altcoin season. Most altcoins are underperforming Bitcoin in the current market structure.
Q: How do prediction markets reflect the crypto bull run? A: Prediction markets price specific binary outcomes, will BTC exceed a specific threshold by a specific date, rather than directional views. The distribution of prices across different BTC milestone contracts gives a more precise and honest picture of market expectations than analyst price targets, because real capital is at stake on every market.
Also read: Crypto Event Markets: Trading BTC Milestones and Protocol Catalysts
Trading the News: An Event Driven Playbook for Prediction Markets
Positive EV Trading: A Practical Framework for Prediction Markets