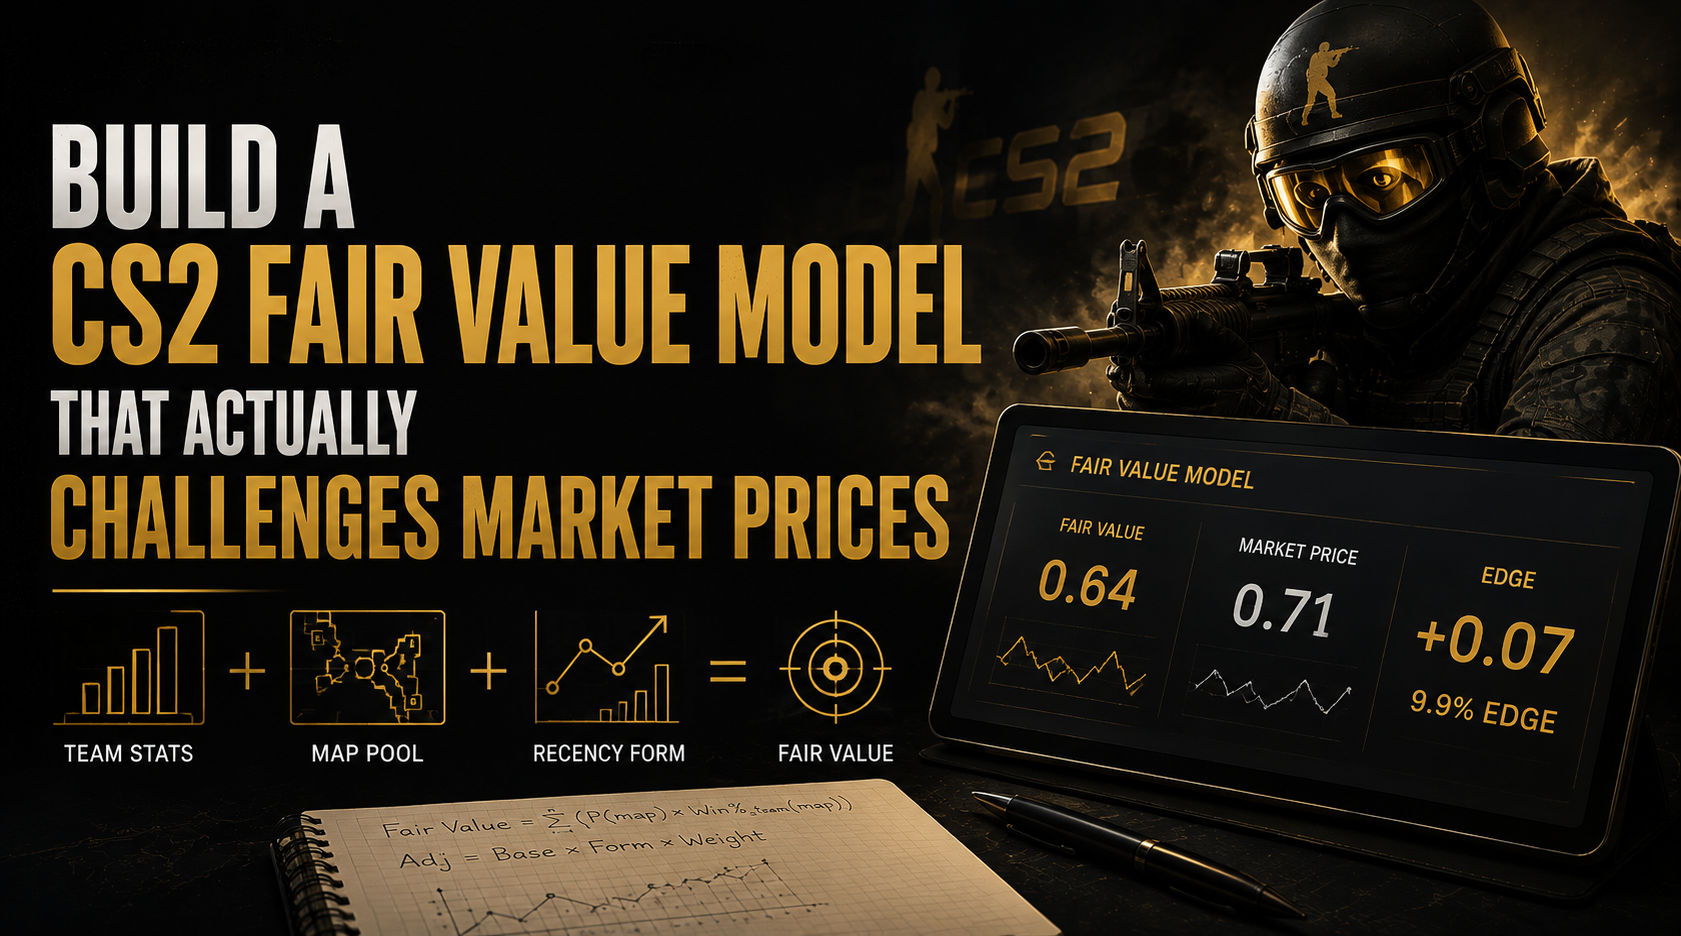
Build a CS2 Fair Value Model That Actually Challenges Market Prices
Here’s the move most CS2 prediction market traders make: they open Polymarket, see NaVi at 0.67, check HLTV, see NaVi has won six of their last ten matches, nod, and buy.
That’s not a model. That’s confirmation shopping.
A real cs2 fair value model produces a number before you touch any odds source. That number is your position. Everything after, the Polymarket price, the Pinnacle line, the Sharps tab, exists to test whether your position is right, not to form it. The sequence matters as much as the math.
Table of Contents
What a CS2 Fair Value Model Is Actually Solving
Every CS2 prediction market price is a probability estimate that has been validated by capital. When enough participants buy YES on NaVi at 0.67, the price reflects the collective view that NaVi has a 67% chance of winning. That collective view incorporates everything the market participants know, HLTV stats, recent form, map pool data, coaching changes, the full picture.
A cs2 fair value model is your attempt to produce a more accurate version of that estimate than the collective view. Not just different, more accurate. The edge lives in the gap between your number and the market price, but only when your number is right and the market is wrong. If your model is no better than the average participant’s intuition, you have no edge regardless of how sophisticated the formula looks.
The cs2 fair value model is the tool that formalises this. The good news: the average Polymarket CS2 participant isn’t using a model at all. They’re using intuition, brand recognition, and recent result momentum. A disciplined three-layer model with proper data filtering consistently outperforms that baseline. It doesn’t take sophisticated machine learning. It takes correct inputs and correct sequence.
Layer One: Building the Base Rate
The base rate answers: historically, what win probability does a team with these characteristics have against a team with those characteristics?
Start with HLTV ratings. But not the headline rating. The filtered rating.
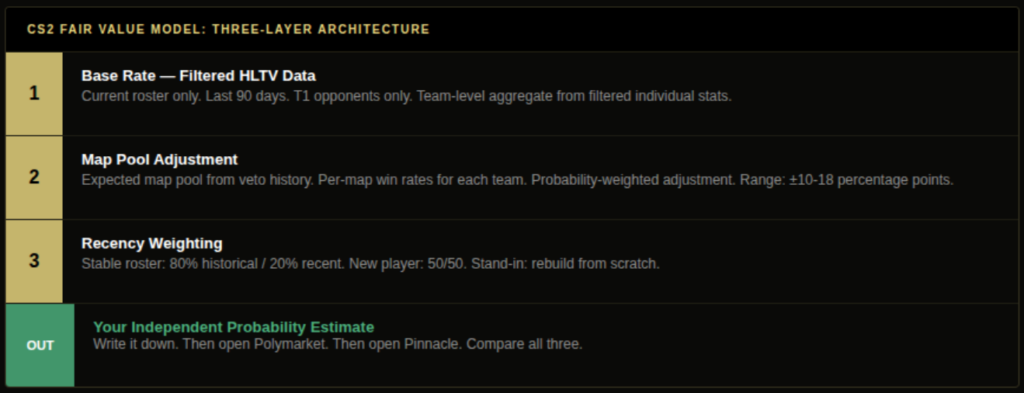
Filter 1: Current roster only. Any historical data that includes players who are no longer on the team is noise. When Spirit added a new IGL six months ago, every Spirit match before that change describes a different team. Reconstructing stats using only current roster members requires using Liquipedia’s event-by-event roster history to identify exactly which five players played each match.
Filter 2: Last 90 days. CS2 team systems evolve too quickly for longer windows to be reliable. A 12-month average smooths over the pre- and post-coaching-change performance in a way that actively misleads you. Ninety days captures current form without over-indexing on recent results. Beyond 90 days, weight by a decay factor.
Filter 3: T1 opponents only. A player averaging 1.24 HLTV Rating against regional T3 opposition and 0.96 against T1 opponents is not a 1.24 player for T1 match prediction. Filter by event tier. HLTV.org allows this in their player stats interface.
After applying all three filters, calculate the team-level aggregate from the filtered individual player stats. This is your performance baseline, the number that describes who these teams actually are right now, not who they were.
Layer Two: The Map Pool Adjustment
A cs2 fair value model built only on aggregate performance data is missing the most predictive variable in any specific match: the map pool.
Map pool win rates on a per-map basis move individual match probabilities by 10-18 percentage points in documented research across 400+ T1 CS2 maps. A team with a 62% aggregate win rate advantage can drop to 51% on a map where the opponent historically dominates, or jump to 74% on a map that plays entirely to their strengths.
The expected map pool comes from two sources: each team’s historical veto tendencies and their current stated map preferences. HLTV’s veto history shows what teams ban first and what they pick. Liquipedia shows their recent matches’ map selections. From these you can build a probability-weighted map pool: for each possible map that could be played, what’s the probability it appears in this series, and what’s each team’s win rate on it?
The map pool-adjusted probability is a weighted average of each team’s win probability across the likely maps, weighted by the probability of each map appearing.
This calculation takes about 20 minutes the first time. Once you’ve built the framework for a team, updating it takes 5 minutes before each match.
Also read: CS2 Esports Odds: How to Read, Compare, and Trade Counter-Strike Markets
Layer Three: Recency Adjustment
The base rate and map pool give you the structural probability. The recency adjustment modifies it based on current trajectory.
How much weight should you give recent results? This is where most amateur models go wrong. They either over-weight recent results (turning a model into a momentum indicator) or ignore them entirely (treating a team that just lost their IGL as equivalent to their historical form suggests).
A reasonable recency weighting approach:
For teams with roster stability (same five players for 90+ days): Give recent form (last 10 matches) 20% weight and the filtered historical base 80% weight. Variance in a 10-match sample is too high to justify a larger recent-form weighting.
For teams with recent roster changes (new player in last 60 days): The historical base rate is now partially invalid. Weight recent form at 50% and historical base at 50%, but only use historical data from the current configuration plus the new player’s prior stats at a different team, adjusted for role fit.
For stand-in situations: Rebuild from first principles. The historical aggregate describes a team that isn’t playing today. Use the stand-in’s stats in the specific role, map pool overlap with their prior teams, and the home team’s system flexibility. This is the highest-variance scenario in the model, acknowledge the uncertainty by explicitly widening your confidence interval.
Devigging: The Step Everyone Skips
You’ve produced your cs2 fair value estimate. Now you need two external reference points: the devigged Polymarket price and the devigged Pinnacle line.
Neither raw price is a probability. Both include margin.
Polymarket devig: Raw YES: 0.63, Raw NO: 0.41. Sum: 1.04. Devigged YES: 0.63/1.04 = 0.606. Devigged NO: 0.41/1.04 = 0.394.
Pinnacle devig: Pinnacle’s CS2 margin runs 1.8-2.2%. The same formula applies. A raw Pinnacle price of 0.64 on a CS2 match devigs to approximately 0.625.
Now you have three numbers: your model estimate, devigged Polymarket, devigged Pinnacle. The comparison between all three determines the decision.
Model says 0.68, Polymarket devigged 0.606, Pinnacle devigged 0.625: Both external references are below your model. Three-way convergence in the same direction. This is your highest-confidence setup. The EV gap on DG3’s Edge Finder should reflect the Polymarket-vs-Pinnacle piece of this, your model adds the third layer of confidence.
Model says 0.68, Polymarket devigged 0.606, Pinnacle devigged 0.668: Polymarket is below your model and below Pinnacle. But Pinnacle is close to your model. One of two things: your model is right and Polymarket is behind Pinnacle’s adjustment, or your model and Pinnacle are both wrong. Check what your model is picking up that Pinnacle might not. If there’s a specific, defensible reason (stand-in announced 40 minutes ago, Pinnacle hasn’t fully adjusted yet), enter. If not, wait.
Model says 0.68, Pinnacle devigged 0.671: Your model barely differs from Pinnacle. The gap after fees is zero or negative. No position.
What the cs2 Fair Value Model Can’t Do
Intellectual honesty about the model’s limitations is as important as the model itself.
It can’t predict individual match variance. A 68% favourite loses roughly 32% of the time. Your cs2 fair value model doesn’t change that. Over 50+ positions it should produce returns above the devigged price. In any individual match it’s a probability distribution, not a guarantee.
It deteriorates quickly after roster changes. The model built on filtered historical data becomes partially invalid the moment a player leaves. The 4-6 week recalibration period after any notable change is a period of explicit model uncertainty, not one to trade aggressively.
It doesn’t account for mental state or travel. A team that flew 15 hours for a match after a brutal losing run has different real performance capacity than a well-rested home team. The model doesn’t see this. Qualitative overlays matter.
It requires calibration to be trusted. You cannot claim your cs2 fair value model has edge until you’ve tracked 50+ positions of entry price versus closing price and confirmed that your entries systematically beat the close. Before that sample size, you have a promising methodology and no proven edge.
Running the Model Before Your Next CS2 Match
The practical sequence for any T1 CS2 fixture:
- Pull filtered HLTV data: current roster, 90 days, T1 tier. Note team-level aggregate for both sides.
- Build expected map pool from veto history. Calculate map-specific win rates.
- Apply recency weighting based on roster stability.
- Produce your probability estimate. Write it down before opening any price source.
- Devig Polymarket. Devig Pinnacle. Compare all three numbers.
- Check DG3 Edge Finder for the EV gap chip on this market.
- Check DG3 Sharps tab for CLV-qualified wallet entries on this specific market.
- Size based on the gap between your model and the devigged market price.
That’s the full sequence. Steps 1-4 take 20-30 minutes once the framework is built. Steps 5-8 take 3 minutes with DG3. The total research time per match is 25-35 minutes. The discipline of step 4, writing your number before opening prices, is the single most valuable habit in the process.
Calibrating the Model: The Loop Most Traders Never Close
Building a cs2 fair value model is the work most traders skip. Calibrating it is the work that even model-builders skip. Calibration is the feedback loop that turns a promising methodology into a documented edge.
Calibration requires three inputs per position: your model’s probability estimate at entry, the entry price you actually got, and the market’s closing price before match start. The closing price, accessible via the Polymarket API after resolution, is the most honest available measure of what the market eventually decided the probability was. Your consistent divergence from that closing price in the positive direction is the evidence of edge.
The sequence: enter the position, record the model estimate and entry price in your tracking sheet, retrieve the closing price after resolution, calculate CLV (closing price minus entry price for YES positions). Do this for 50 positions. The distribution of your CLV across those 50 positions tells you whether your cs2 fair value model is producing genuine edge or sophisticated-looking guesses.
If average CLV is positive across 50+ positions in the same market type, your model is working. If it’s near zero or negative, something is wrong: either your inputs are contaminated (lookahead bias, unfiltered stats), your comparison against the market is incorrect (not devigging), or your independent estimate was formed after seeing the market price (anchoring).
The calibration loop is what separates a cs2 fair value model from a research ritual. The ritual feels like work. The model produces documented evidence of whether that work is generating returns.
Common CS2 Fair Value Model Mistakes That Invalidate the Output
Building the framework is only half the work. Applying it correctly session-to-session is where the discipline produces or destroys edge.
Mistake one: anchoring to the market price before forming your model estimate. The sequence is model first, market second. If you check Polymarket, see NaVi at 0.67, and then build your cs2 fair value model, the model output will cluster around 0.67 regardless of what the filtered data says. Write your independent estimate before opening any price source.
Mistake two: updating your model estimate based on the Sharps tab or Pinnacle line before deciding whether to enter. Both are valuable validation checks, but only against an estimate you’ve already formed. If a CLV-qualified wallet is heavily positioned on NaVi YES and you haven’t formed your own estimate yet, you’re copying their position, not validating yours.
Mistake three: recalibrating your model parameters too frequently based on small samples. If your model shows three consecutive incorrect directional calls, that’s 3 data points in a high-variance binary outcome environment. It’s not statistically meaningful. A cs2 fair value model calibration requires 50+ positions before any structural changes are justified.
Frequently Asked Questions
Q: How do you build a CS2 fair value model for prediction markets? A: Three layers: a base rate from HLTV data filtered to current roster, last 90 days, and T1 opponent tier. A map pool adjustment using expected veto analysis and per-map win rates, which can shift the match probability by 10-18 percentage points from the base rate. A recency weighting that accounts for roster stability, giving more weight to recent results for recently changed rosters. Produce your probability estimate before consulting any market price, then devig both Polymarket and Pinnacle separately and compare all three numbers. The discipline of forming your estimate before opening prices is as important as the methodology itself. a base rate from HLTV data filtered to current roster, last 90 days, and T1 opponent tier. a map pool adjustment using expected veto analysis and per-map win rates. and a recency weighting that accounts for roster stability. Produce your probability estimate before consulting any market price, then compare against devigged Polymarket and devigged Pinnacle.
Q: What data does a CS2 fair value model need? A: HLTV player ratings (filtered to current roster, 90 days, T1 tier), KAST percentages, opening kill differentials, map-specific win rates for the expected map pool, Liquipedia roster history by event for lookahead-bias prevention, and Pinnacle CS2 lines for external validation.
Q: Why do you need to devig Polymarket and Pinnacle separately? A: Both raw prices include embedded margin. A raw Polymarket price of 0.63 on YES contains approximately 4 cents of margin. The devigged probability (0.606) is what you compare against your model. Comparing raw prices inflates apparent edge by 2-4 cents per position, which meaningfully changes Kelly sizing.
Q: How many positions do you need before trusting a CS2 fair value model? A: At least 50 positions in the same market type before any calibration conclusions are statistically meaningful. Below 50, you can detect catastrophic model errors. At 100+, you can identify systematic bias and refine model weights. Claiming proven edge before 50 positions is statistically indefensible.
Q: What is the map pool adjustment in a CS2 fair value model? A: A modification to the base rate probability that accounts for the specific maps likely to be played in the match. Each map has a different win probability for each team. The expected map pool is probability-weighted across all possible maps. The adjustment can shift match probability by 10-18 percentage points from the base rate.
Also read: CS2 Prediction Markets: The Complete Guide for Traders in 2026
Fair Value in Prediction Markets
CS2 Odds Comparison Tool: How to Find the Best Line Across Prediction Markets