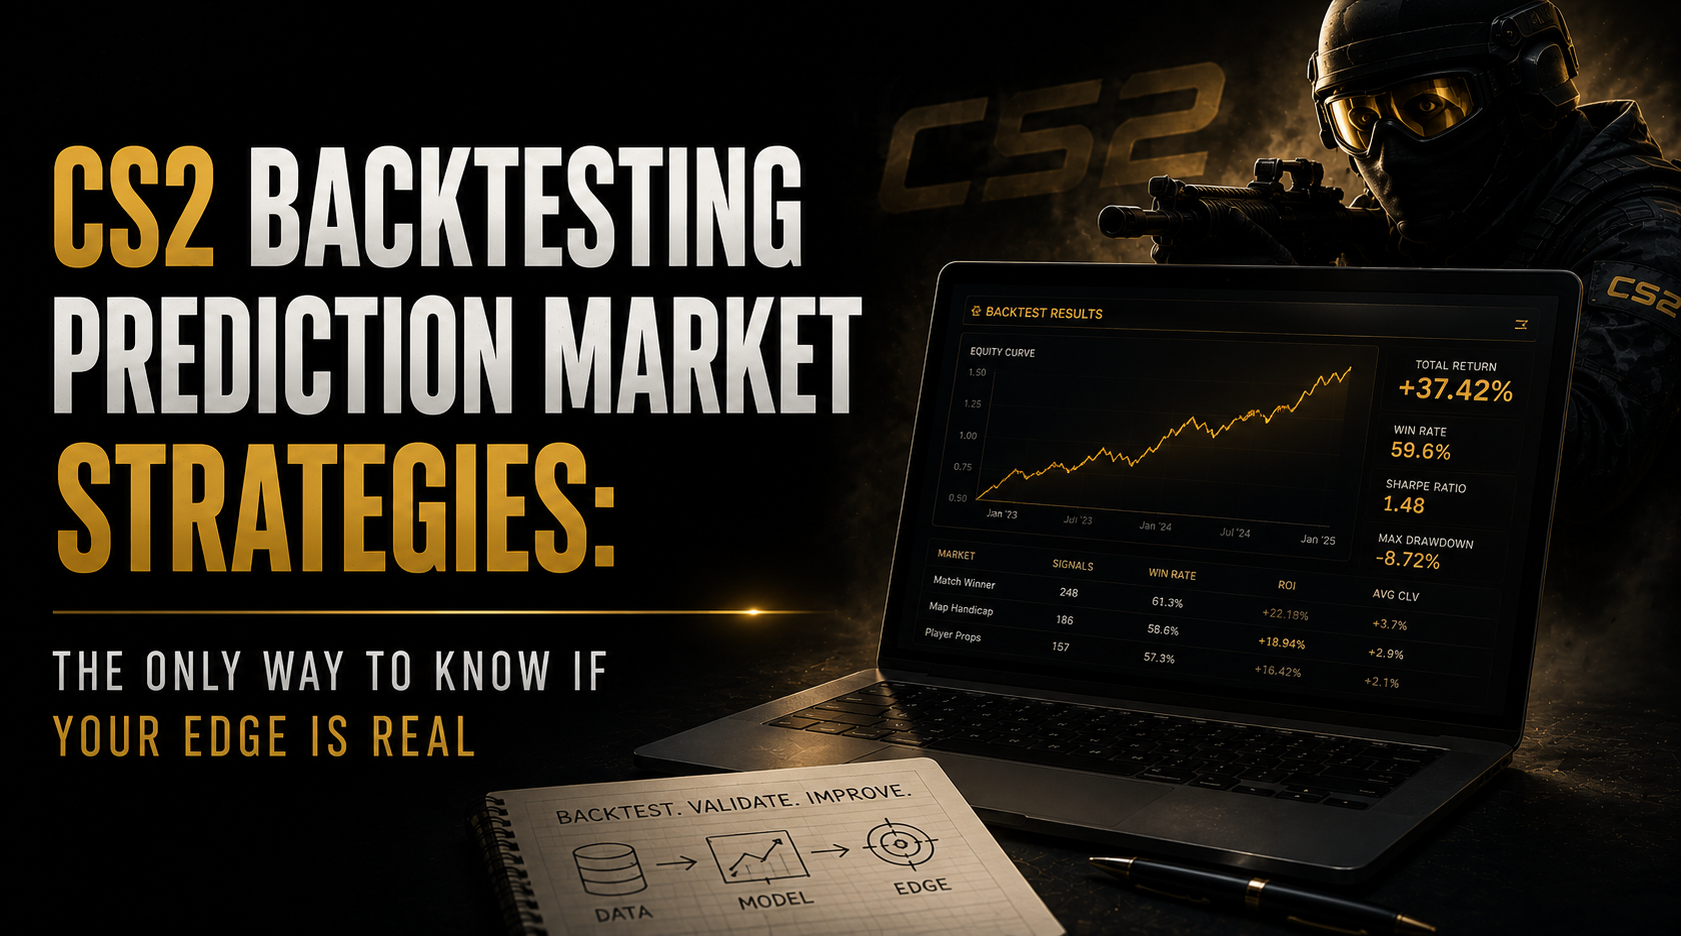
CS2 Backtesting Prediction Market Strategies: The Only Way to Know If Your Edge Is Real
Every CS2 prediction market trader has a theory. Most have never tested theirs.
“I’m better at reading map pool mismatches than the average participant.” Maybe. How many positions have you taken where map pool mismatch was your primary thesis? What was your average CLV on those? Do you actually outperform on them?
Without CS2 backtesting prediction market strategies against historical data, these questions have no honest answers. They have feelings and selective memory, which is not the same thing.
This guide covers how to backtest CS2 prediction strategies correctly, including the three failure modes that invalidate most amateur backtests before they produce a single useful insight.
Table of Contents
Why Most CS2 Backtests Are Wrong Before They Start
The three failure modes show up in almost every amateur CS2 backtesting prediction market attempt. Getting any one of them wrong invalidates the entire exercise.
Failure Mode 1: Lookahead bias. Your backtest uses information that wasn’t available at the time of the simulated trade. The most common version: you build your CS2 model using the current HLTV stats of a team, then test it on historical matches from 18 months ago, without checking what the roster was at the time of each match. You’re evaluating 2024 Team Spirit’s statistics on matches played by 2023 Team Spirit with a different IGL. The results look good. They’re meaningless.
Fix: for every simulated historical position, reconstruct the match’s feature set using only data with a timestamp before the match date. This requires Liquipedia’s roster-by-event database, not just the current team page.
Failure Mode 2: Survival bias. You test only on teams that are still active in 2026. This excludes all the matches played by organisations that dissolved, got banned, or dropped out of T1 CS2 over the last three years. Those matches include some of the most dramatic mispricings in the historical data, and excluding them makes your model look better than it is on real forward-looking data.
Fix: pull your historical match list from a complete tournament database that includes all teams that participated, not just those currently active. HLTV’s historical match results cover this.
Failure Mode 3: In-sample overfitting. You add parameters to your model until it fits the training data perfectly. You add map pool adjustments with specific coefficients, form windows of precisely 73 days, opponent-tier weightings calibrated to your training set. The model achieves 74% prediction accuracy on your training data. You deploy it. It achieves 54%.
Fix: define your model structure before analysing any data. Commit to the three-layer architecture. Set the out-of-sample test period before model building begins. Never touch the test data until the model is fully built. If you ran your backtest on 2022-2024 data, your test set is 2025 and later, genuinely untouched.
Data Sources for CS2 Backtesting Prediction Market Research
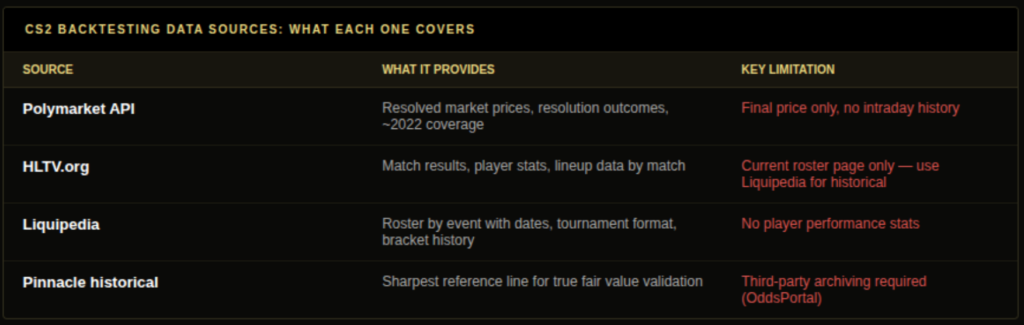
Getting the right data is 80% of any valid CS2 backtesting prediction market exercise. Before running a single cs2 backtesting prediction market simulation, assemble all four sources. The cs2 backtesting prediction market community has converged on four primary sources, each covering a different part of the required dataset.
Polymarket event history (API): Polymarket’s public API returns resolved market data for past CS2 events: question text, final prices, and resolution outcomes. Coverage extends to approximately 2022. The limitation for CS2 backtesting prediction market work: the API returns the final market price before resolution, not granular intraday price history. For strategies that depend on entry timing (stand-in signal entries, for example), this is insufficient. For pre-match open price strategies, it’s adequate.
HLTV.org match results: The definitive CS2 match result database. Covers T1-T3 professional matches globally. Player stats, map scores, event context, and team configurations are available for matches going back years. The lineup data is what makes this essential for avoiding lookahead bias, confirm who actually played each historical match.
Liquipedia match history: Structured tournament data with bracket results, roster history with dates, prize pool tiers, and event formats. Essential for two things: building the roster-history layer that prevents lookahead bias, and understanding tournament context (dead rubber matches, bracket pressure situations).
Pinnacle historical lines: Available through third-party archiving services including OddsPortal and BettingTips4You for major CS2 events from approximately 2020 onward. These are necessary for validating whether your model was identifying genuine mispricings relative to the sharpest available reference, not just gaps against Polymarket’s retail-heavy pricing.
What Validated CS2 Backtesting Prediction Market Research Actually Finds
Several independent CS2 backtesting prediction market researchers have published findings across public forums and private research groups. The consistent results across multiple studies:
Favourite-longshot bias is real and persistent. Heavy favourites, implied probability above 0.75, on Polymarket CS2 match winner markets have been historically overpriced by 3-6 cents relative to actual outcomes, across documented sample sets covering ESL Pro League S15-S20. This is the most replicated finding in CS2 prediction market research. The mechanism is audience-driven: Polymarket’s CS2 participant pool skews toward fans who price brand reputation and historical success rather than current form.
Stand-in signal edge exists but the window is narrow. In a documented 47-match sample of confirmed stand-in announcements during major CS2 events in 2024-2025, Polymarket prices at the time of announcement averaged 4.2 cents above the implied fair value from the stand-in’s historical performance in that role. The edge window was 12-25 minutes. After 25 minutes, the gap was fully closed.
Map pool exploitation requires current roster data to retain value. Backtests of map pool strategies using current roster data (lookahead contamination) showed 8-12% edge. The same backtests corrected for actual historical rosters showed 3-5% edge. The pattern is genuine, but it’s smaller and more specific than naive implementations suggest.
Overtime mispricing is real and not worth trading at scale. Historical analysis shows consistent 2-cent mispricing on overtime map winner contracts. After Polymarket’s 2% fee, net edge is approximately zero on most positions. Documented but not usable at typical position sizes.
Building Your Own CS2 Backtesting Prediction Market Framework
For traders who want to build their own CS2 backtesting prediction market framework, Python with pandas and the Polymarket API client is the most accessible path.
The structure of a minimal valid backtest:
Step 1: Define the strategy before touching data. Write down exactly what you’re testing. “I will enter YES on the underdog (implied probability below 0.40) in CS2 match winner markets when my filtered HLTV model shows a gap of less than 0.10 from the favourite, indicating the market has overweighted the favourite.” That’s a testable strategy. “I’m looking for value in underdog markets” is not.
Step 2: Pull historical Polymarket CS2 markets. Use the Polymarket API to pull all resolved CS2 match winner markets from your chosen period. Record question text, final price before resolution, and resolution outcome.
Step 3: Match each Polymarket market to HLTV data. For each historical match, pull the lineup from Liquipedia (confirming who actually played), then pull filtered HLTV stats for each player on those lineups as of the match date. This is the most time-consuming step and the one most often skipped. Don’t skip it.
Step 4: Apply your strategy criteria. For each historical market, apply your entry criteria. Does the devigged Polymarket opening price meet your threshold? Does your model agree with the direction? Record simulated entry price, simulated exit price (closing Polymarket price), and the CLV for each position.
Step 5: Measure edge, not just P&L. The output you want from CS2 backtesting prediction market research is average CLV across your simulated positions, not total P&L. P&L in a backtest reflects both skill and the variance in your historical sample. CLV measures whether you were consistently entering before the market moved in your direction, which is the only durable signal of genuine edge.
What Good CS2 Backtesting Results Look Like
A result that passes these filters still isn’t a guarantee of future performance. It’s a validated hypothesis that deserves real capital testing at small scale before any sizing up. The backtest tells you the strategy has worked on historical data with the methodology intact. Live trading tells you whether it works going forward as market conditions continue evolving.
A valid backtest that confirms genuine edge will show:
Average CLV notably above zero across your full sample. For CS2 strategies, +3 to +8 cents average CLV across 50+ positions is meaningful. Above 8 cents should prompt investigation, either you’ve found a large inefficiency (possible) or your backtest has a methodological error (more likely to verify first).
Performance on out-of-sample data that’s at least 60% as strong as in-sample. If your model achieves +7 cents CLV on 2022-2024 training data and +1 cent on 2025 test data, the model is overfit. The test set performance is your real forward-looking expectation.
No single position accounting for more than 15% of total P&L. If one position dominates your backtest results, your sample is too small or a single anomalous event is skewing everything. Filter it out and re-evaluate.
A strategy that fails these tests isn’t necessarily a bad idea. It’s an untested idea, which is a different thing. Keep the methodology, collect more data, extend the test period, and re-examine when the sample is large enough to tell you something reliable.
Why Most CS2 Backtesting Prediction Market Work Fails in Practice
Academic and semi-professional cs2 backtesting prediction market research has three failure modes beyond the three listed at the top of this guide. These appear in the implementation phase rather than the methodology phase.
Failure Mode 4: Position size doesn’t account for correlation. If your CS2 backtest includes multiple matches from the same tournament, those positions are correlated. NaVi losing in the quarterfinal affects their probability in the semifinal outright market. Kelly fractions calculated as if each position is independent oversize correlated bets. Adjust for correlation by treating all positions from the same tournament bracket as a single meta-position for sizing purposes.
Failure Mode 5: The backtest period is a structural outlier. CS2 underwent a notable competitive reshuffling in 2023-2024. Teams that dominated 2021-2022 declined sharply. New organisations emerged. A backtest built entirely on 2021-2022 data reflects a market structure with different dominant teams, different predictability patterns, and different brand premium dynamics. Always check whether your training period was structurally similar to the period you’re deploying into.
Failure Mode 6: No distinction between “the model is wrong” and “variance happened.” A CS2 backtest that shows strong training-set performance followed by a 12-position losing run on out-of-sample data is potentially showing either a model that overfits and fails out-of-sample, or a model that’s correct but ran through a variance-driven losing run. The way to distinguish them: check whether the individual position edges were positive at entry (was the model selecting positions with positive EV?) regardless of outcome. If the model was selecting positive-EV positions that lost, that’s variance. If it was selecting negative-EV positions, the model has a systematic error.
The One Number That Tells You Whether Your CS2 Backtesting Prediction Market Work Is Valid
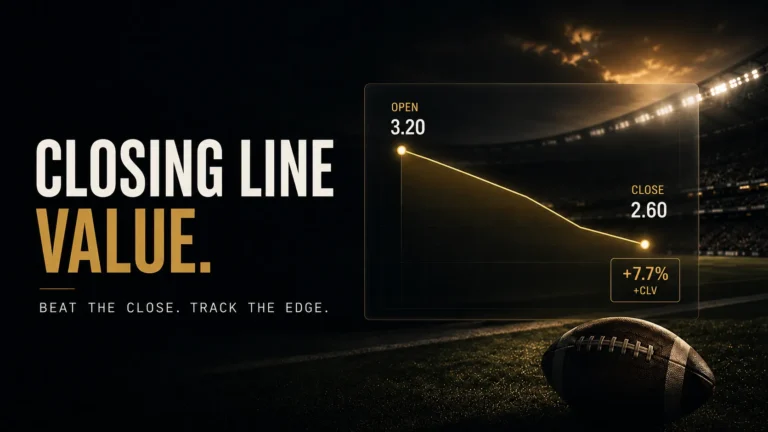
Average closing line value across your out-of-sample positions. Not P&L. Not win rate. CLV.
A cs2 backtesting prediction market exercise that shows positive average CLV on the out-of-sample test set, meaning your simulated entries were consistently at prices below the market’s eventual closing price, is evidence of a strategy that found edge before the market did. This is the correct signal.
P&L in a backtest is heavily influenced by the variance in your historical sample. A lucky 15-match winning run in your test set can make a zero-edge strategy look highly profitable. CLV strips out outcome variance: it measures only whether your entries preceded market movement in your direction, which is the skill component independent of the coin flips.
For a CS2 prediction market strategy to be considered validated by backtesting, the minimum acceptable evidence is: positive average CLV on the out-of-sample test set, with a 95% confidence interval that excludes zero given your sample size. For most sample sizes available to independent CS2 researchers (50-150 out-of-sample positions), this requires average CLV above 2-3 cents to reach statistical significance. Below that, even positive average CLV may be indistinguishable from zero at the available sample size.
Frequently Asked Questions
Q: How do you backtest a CS2 prediction market strategy? A: Define the strategy precisely before touching any data, what market type, what entry criteria, what pricing relationship triggers consideration. Pull historical Polymarket CS2 market data via the API. Match each market to the actual HLTV lineup data as of that match date, not current lineups. Apply strategy criteria to identify simulated entry positions. Calculate CLV for each simulated position by comparing entry price to closing price. Measure average CLV on out-of-sample data only, with at least 50 positions before drawing any conclusions. The out-of-sample split needs to be defined before model building begins, not after. Pull historical Polymarket CS2 market data via the API. Match each market to HLTV lineup data as of the match date. Apply strategy criteria. Calculate CLV (entry price vs closing price) for each simulated position. Measure average CLV on out-of-sample data only.
Q: What data do you need for CS2 backtesting prediction markets? A: Polymarket API event history (resolved CS2 markets), HLTV match results with per-match lineup data, Liquipedia roster history by event date, and Pinnacle historical lines from archiving services. The lineup-by-date data from Liquipedia is the most critical and most often missing piece.
Q: What is lookahead bias in CS2 backtesting? A: Using information in your simulated historical trade that wasn’t available at the time of the actual match. The most common form is using a team’s current HLTV stats to evaluate historical matches when the team had different players. Fix by rebuilding each match’s feature set using only data timestamped before that match.
Q: How many positions do you need for a valid CS2 backtest? A: A minimum of 50 positions to detect meaningful edge above chance. At 30 positions you can identify catastrophic errors. At 100+ positions you can detect systematic bias. For CS2-specific sub-strategies (stand-in markets only, overtime maps only), each sub-category needs its own 30-50 position minimum.
Q: What is the most consistently backtested edge in CS2 prediction markets? A: Favourite-longshot bias. Heavy favourites above 0.75 implied probability have been historically overpriced by 3-6 cents on Polymarket CS2 match winner markets across multiple independent sample sets covering ESL Pro League S15-S20. The mechanism is documented and consistent: Polymarket’s CS2 participant pool prices brand recognition rather than current form for historically dominant teams. Stand-in signal edge is the second most validated finding, with documented 4.2 cent average mispricing in a 47-match sample at the time of announcement. Heavy favourites above 0.75 implied probability have been historically overpriced by 3-6 cents on Polymarket CS2 match winner markets across multiple independent sample sets covering ESL Pro League S15-S20.
Also read: CS2 Prediction Market Data: How to Build a Fair Value Model
Closing Line Value in Prediction Markets: The Only Honest Scoreboard
Information Asymmetry: Who Knows What, and When, in Event Markets