Correlated Markets in Prediction Markets: Managing Portfolio Risk
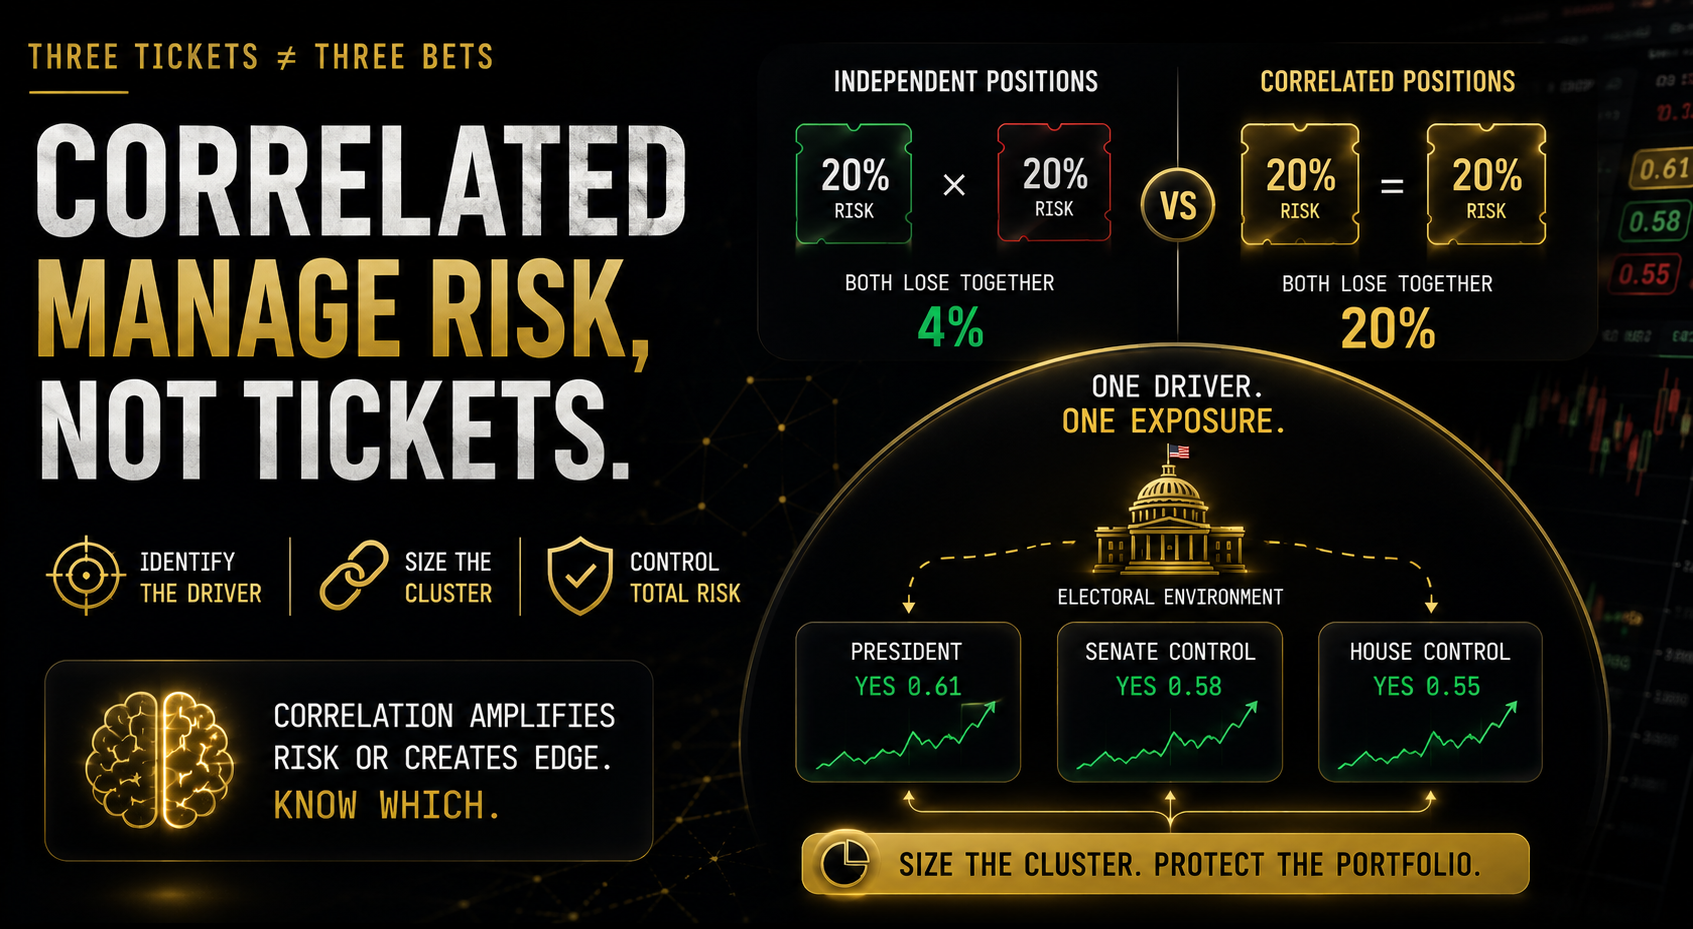
You hold YES on the incumbent winning the presidency, YES on their party keeping the Senate, and YES on their party keeping the House. Three positions. Three tickets you bought separately, on three different days, each one feeling like a distinct decision. They are not three decisions. They are one bet on the electoral environment, sized three times over, and most traders never notice until the night they all win or lose together.
Table of Contents
Quick Answer
Correlated markets are prediction markets whose outcomes move together because they share an underlying driver, such as an election cycle, a macroeconomic factor, or a single sporting event. Holding multiple correlated positions, even when each is individually sized conservatively, can produce combined exposure equivalent to one much larger position on the shared outcome. Managing correlation requires identifying shared drivers, sizing exposure at the cluster level rather than per-market, and in some cases using the correlation itself to construct hedges rather than treating it purely as risk.
What Are Correlated Markets in Prediction Markets?
Correlated markets are two or more markets whose outcomes are statistically linked, meaning knowing the result of one changes your expectation of the other. This is different from independent markets, where one outcome carries no information about the other.
Election markets are the clearest example. “Will the incumbent party win the presidency” and “will the incumbent party control the Senate” are not independent events. They both depend heavily on the same underlying national political environment, voter turnout patterns, and economic conditions. A trader who holds YES on all three related contracts, each at what looks like a conservative individual size, has not built a diversified portfolio. They have built one concentrated bet on the electoral environment, expressed across three tickets instead of one.
The mistake is subtle because each individual position can look reasonably sized in isolation. The problem only becomes visible when you calculate the combined exposure to the single underlying factor driving all three.
How Correlation Amplifies Risk
The mathematics of correlated exposure is straightforward once you see it laid out, even though most traders never run the calculation explicitly. Two independent positions, each with a 20% chance of losing, have a combined probability of both losing together of roughly 4%, since the two failures need to happen independently. Two perfectly correlated positions with the same 20% individual loss probability have a combined probability of both losing together of the full 20%, because when one fails, the other fails with it.
That gap, 4% versus 20%, is the entire risk management problem in one comparison. A trader who calculated their portfolio risk assuming independence, when the real correlation was high, has meaningfully underestimated how much capital is genuinely at risk on a single bad outcome.
Sports markets carry this same dynamic. A same-game combination of “Team A wins” and “Star Player A scores over 20 points” are correlated, since the player’s strong performance and the team’s win frequently occur together. Treating both as independent positions overstates the actual diversification benefit of holding both.
Using Conditional Probability to Map Correlation
Conditional probability, the probability of one event given that another has occurred, is the practical tool for quantifying correlation before you size positions.
Ask directly: given that the incumbent party wins the presidency, what is the probability they also hold the Senate? If that conditional probability is meaningfully higher than the unconditional probability of holding the Senate on its own, the two markets are positively correlated, and the strength of that gap tells you roughly how much the correlation should affect your combined sizing. That’s the whole mechanism.
This does not require a precise statistical model for every position. Even a rough qualitative assessment, high, moderate, or low correlation, based on whether the two markets share an obvious underlying driver, is enough to meaningfully improve your sizing decisions compared to treating every position as independent by default, which is the more common and more costly error.
3 Correlation Types and How to Handle Them
| Correlation Type | Example on Polymarket | Risk Impact | Management Approach |
|---|---|---|---|
| Shared outcome (direct) | Spain winner + Pedri top scorer | High amplification | Size as one combined Kelly position |
| Macro factor correlation | Fed cut + equity direction | Moderate amplification | Cap total macro cluster exposure |
| Information cascade (temporary) | Primary market moves, related markets lag | Opportunity (not risk) | Trade the lagging markets before convergence |
For shared outcome correlation, identify every market in the cluster, decide your total desired exposure to the shared outcome, and distribute that total across the individual markets rather than sizing each one as if it were the only position you held. For macro factor correlation, identify the shared driver, whether that is a Fed decision or an economic data release, and cap your total exposure across every market tied to that driver at your intended overall Kelly fraction. For information cascade correlation, the lagging market is often mispriced relative to the one that already moved, which makes it a trading opportunity in the direction of the primary market’s movement rather than a risk to manage defensively.
Portfolio Exposure vs Per-Position Exposure
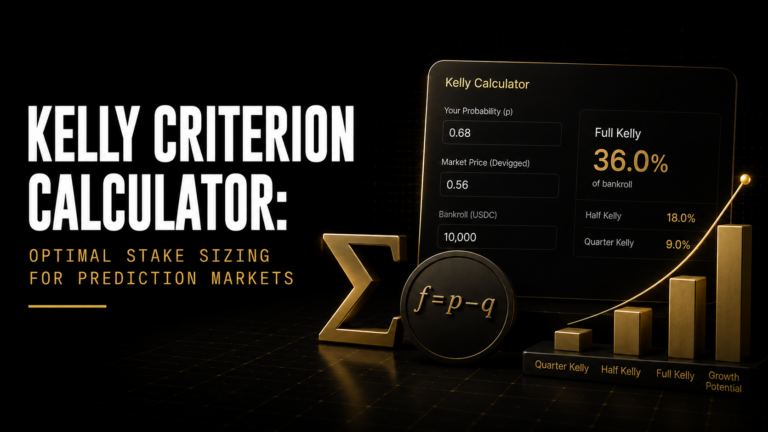
Position sizing frameworks like Kelly, discussed at length elsewhere, are built around a single position in isolation. They do not automatically account for correlation across your broader book, which means applying Kelly correctly to five individual markets can still leave you badly oversized at the portfolio level if those five markets share an underlying driver.
The fix is a second layer of position sizing that operates above the individual trade level. Calculate your Kelly fraction per position as usual, then group positions by shared driver and check the combined exposure against a portfolio-level cap. A common approach among systematic traders caps total exposure to any single correlated cluster at the same fraction they would apply to one large position on that cluster’s shared outcome, rather than summing several individually-sized positions without adjustment.
Hedging With Correlated Positions
Correlation is not purely a risk to manage away. It can also be used deliberately to construct a hedge. If you hold a large YES position on an outcome and a correlated market exists whose NO side moves in the same direction as your existing position’s risk, taking a smaller position on that correlated NO can partially offset your primary exposure without fully closing it.
This works best when the correlation is well understood and reasonably stable, since a hedge built on a correlation that breaks down under stress can fail exactly when you need it most. Election markets again provide a clean example: a trader heavily exposed to one candidate winning the presidency might take a smaller offsetting position in a correlated down-ballot market where the same candidate’s underperformance would resolve favorably, partially smoothing the overall portfolio outcome.
Common Mistakes
Mistake 1: Sizing each position as if it were the only one you hold. This is the single most common correlation error in the entire discipline, and it is almost never a math mistake. It is a bookkeeping mistake, the failure to notice that three related election markets, each opened on a different day and each feeling like its own independent decision at the time, are actually one combined exposure to the same electoral environment wearing three different tickets.
Mistake 2: Assuming correlation only matters for obviously related markets. Hidden links, like two seemingly unrelated markets that both depend on a shared macroeconomic condition, are more dangerous than obvious ones because you are not even looking for them.
Mistake 3: Treating all correlation as equally strong. A loose correlation and a near-perfect one aren’t the same discount.
Mistake 4: Ignoring correlation cascades in fast-moving events. During a live sporting event or a fast-breaking news cycle, correlated markets can all move together in a way that amplifies losses faster than a trader expects if they were sized assuming independence.
Mistake 5: Building a correlation-based hedge without stress-testing it. A trader holding a large YES position on an incumbent winning the presidency takes a smaller offsetting position on a correlated down-ballot market, reasoning that if the incumbent underperforms, the down-ballot NO pays out and cushions the loss. That relationship holds fine in a normal election cycle. It does not hold in a genuine tail event, like a late-breaking scandal that simultaneously craters the incumbent’s national numbers and triggers a broader anti-incumbent wave down the ballot, moving both positions against the trader at once instead of one offsetting the other. A hedge built on a correlation that only holds under calm conditions can fail exactly when the portfolio needs it most, sometimes in the precise direction that removes its protective value entirely.
Seeing the Cluster, Not Just the Positions
Manually tracking correlation across a growing book of open positions is difficult to do consistently, especially across fast-moving events where new correlated markets appear quickly. DG3’s Portfolio screen groups open positions by category – Sports, Politics, Crypto, Macro, Other – and shows total exposure by category as a single figure, surfacing correlated clusters that might otherwise be sized as if they were independent.
Seeing your total exposure to a single shared outcome, rather than just a list of individually-sized positions, makes it far easier to catch the kind of hidden concentration that turns three conservative-looking bets into one oversized one.
Frequently Asked Questions
Q: What are correlated markets in prediction markets? A: They are two or more markets whose outcomes move together because they share an underlying driver, such as an election cycle or a macroeconomic factor. Knowing the outcome of one market changes your expectation of the correlated one.
Q: How does correlation increase risk in a prediction market portfolio? A: Correlated positions fail together rather than independently, which means the combined probability of a bad outcome across a correlated cluster is much higher than treating each position as an independent risk would suggest.
Q: How do I identify correlated positions on Polymarket? A: Look for markets that share an obvious underlying driver, like the same election cycle, the same macroeconomic event, or the same sporting match, and use conditional probability reasoning to estimate how strongly they move together.
Q: What is conditional probability in the context of correlated markets? A: It is the probability of one event given that another has already occurred. Comparing that conditional probability to the unconditional probability of the second event reveals how strongly the two markets are correlated.
Q: Can I hedge one prediction market position with another? A: Yes, if a correlated market’s opposing side moves favorably when your primary position is at risk, a smaller offsetting position can partially hedge your exposure, though this requires the correlation to be stable and well understood.
Q: How should I size positions across correlated markets? A: Calculate your desired total exposure to the shared underlying outcome first, then distribute that total across the individual correlated markets, rather than sizing each market independently as if it carried no shared risk with the others.
Q: What is portfolio exposure versus per-position exposure in prediction markets? A: Per-position exposure looks at each trade in isolation. Portfolio exposure aggregates exposure across all positions tied to the same underlying driver, which is the more accurate measure of true risk when correlated markets are involved.
Q: Why do election markets carry high correlation risk? A: Because presidential, Senate, and House outcomes all depend heavily on the same shared national political environment, voter turnout, and economic conditions, making them move together far more than independent markets would.
Final Thoughts
Correlation is the risk that hides in plain sight because every individual position can look perfectly reasonable on its own. The damage shows up only when you calculate the combined exposure to whatever single factor is actually driving three, four, or five of your open positions at once.
The traders who manage this well are not necessarily avoiding correlated markets altogether. They are pricing the correlation explicitly, sizing the cluster as one exposure rather than several, and occasionally using that same correlation deliberately to build a hedge instead of just discovering it the hard way when everything moves together on the same night.
Combine this with disciplined bankroll management to make sure your total portfolio exposure, correlated clusters included, stays inside limits you actually chose on purpose.
Also read:
Kelly Criterion for Prediction Markets: Sizing Positions When Odds Move
Bankroll Management
Half Kelly, Quarter Kelly, Full Kelly: Choosing Your Fraction