How to Track Your Polymarket P&L (And Why Most Traders Get It Wrong)
Polymarket’s native interface will tell you your balance. It will not tell you whether you are a good trader. Those are different numbers, and most Polymarket traders only know one of them.
Your balance includes variance. It includes markets that moved in your favour by luck. It includes markets you misjudged but won anyway because a 30% probability event resolved NO. Tracking your balance and calling it P&L is like a poker player counting chips after one session and concluding they have found an edge. The sample is wrong. The metric is wrong. The conclusion is wrong.
Getting P&L right on Polymarket means tracking five numbers, not one.
Table of Contents
Quick Answer
Polymarket’s native P&L display shows balance changes but does not separate skill from variance, realized from unrealized profit, or EV-adjusted return from raw results. Traders who track only balance will systematically misread their own performance. The five metrics that matter: realized P&L, unrealized P&L (mark-to-market), EV-adjusted return, win rate by probability band, and bankroll growth rate. DG3’s Portfolio screen captures position-level data including entry price, fair value at entry, and resolution outcome, building the calibration dataset as you trade.
Key Takeaways
- Polymarket shows your USDC balance and recent trade history. It does not calculate EV-adjusted return, separate realized from unrealized profit, or tell you whether your wins came from skill or from variance. Every one of those gaps is a gap in your understanding of your own trading.
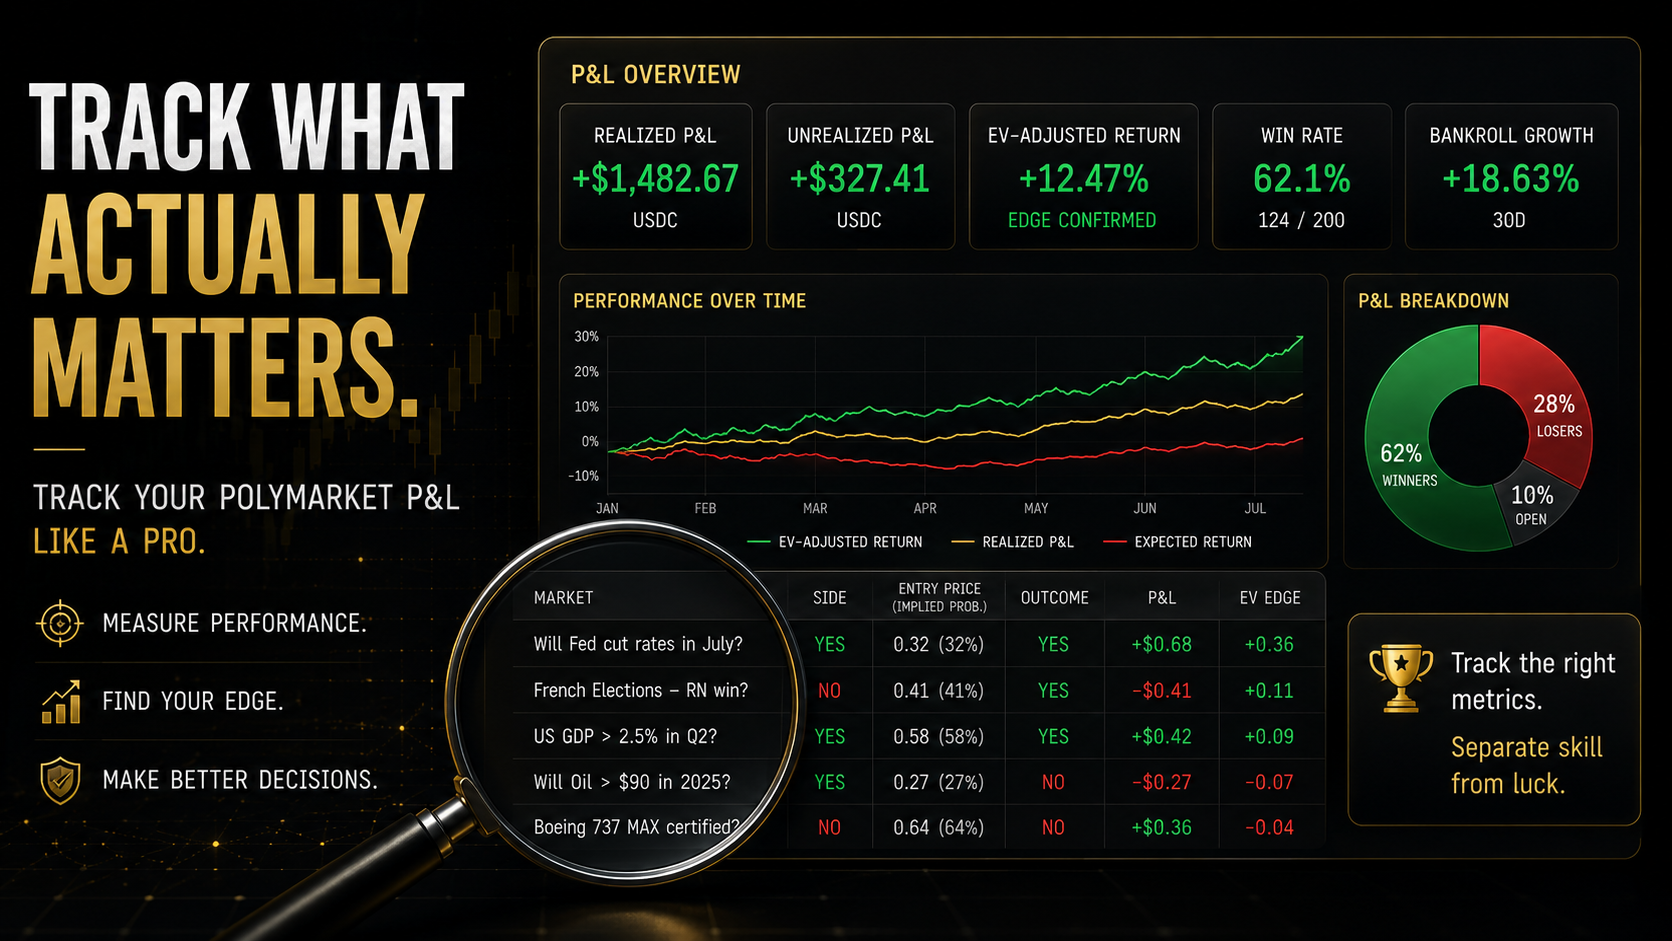
- Realized P&L is cash in hand from positions that have resolved. Unrealized P&L is the mark-to-market value of open positions at current prices. Treating unrealized profit as real profit before resolution is one of the most expensive mindset errors in prediction market trading.
- EV-adjusted return is the metric that tells you whether you are actually good. It compares your realized results against what was statistically expected given your entry prices. A trader with positive EV-adjusted return over 100 positions is demonstrating skill. A trader with positive raw P&L over 20 positions may just be experiencing a good run.
- Win rate without entry price context is meaningless. Going 14-6 at an average entry price of 0.60 is a losing calibration record. Going 14-6 at an average entry price of 0.40 is excellent. The number that matters is not the win rate. It is the win rate relative to what the market implied at entry.
- On-chain transaction history on Polygon is the ground truth for your Polymarket activity. If the native interface shows something that does not match your expectation, the blockchain record is the authoritative source.
- DG3’s P&L Tracker captures entry price, market-implied probability at entry, EV-adjusted return, and resolved outcome at the position level, building the dataset needed to distinguish genuine edge from variance over time.
Why Polymarket P&L Sometimes Looks Wrong
Three structural reasons Polymarket’s native P&L display can confuse traders.
Unrealized positions are included in the balance. Your Polymarket USDC balance reflects the current mark-to-market value of your open positions plus your available cash. If you hold YES contracts on a market that has moved from 0.45 to 0.70 since entry, that unrealized gain is reflected in your displayed balance. When the market resolves, the gain becomes realized or it disappears. Traders who read the balance as profit before resolution are counting chickens.
The display does not separate markets you are in from cash on hand. Depending on how you read the interface, the figure shown can combine settled funds with the current market value of open positions. This makes it difficult to know your true liquid balance without working through each open position individually.
Gas costs paid for transactions are not tracked inside Polymarket. Every trade on Polymarket involves Polygon gas. Those gas costs are not deducted from the Polymarket P&L display. A trader who has made 300 trades over six months has paid meaningful gas costs that do not appear in their Polymarket performance figures. The true net return is lower than the displayed figure by the total gas paid.
The 5 Metrics Every Prediction Market Trader Should Track
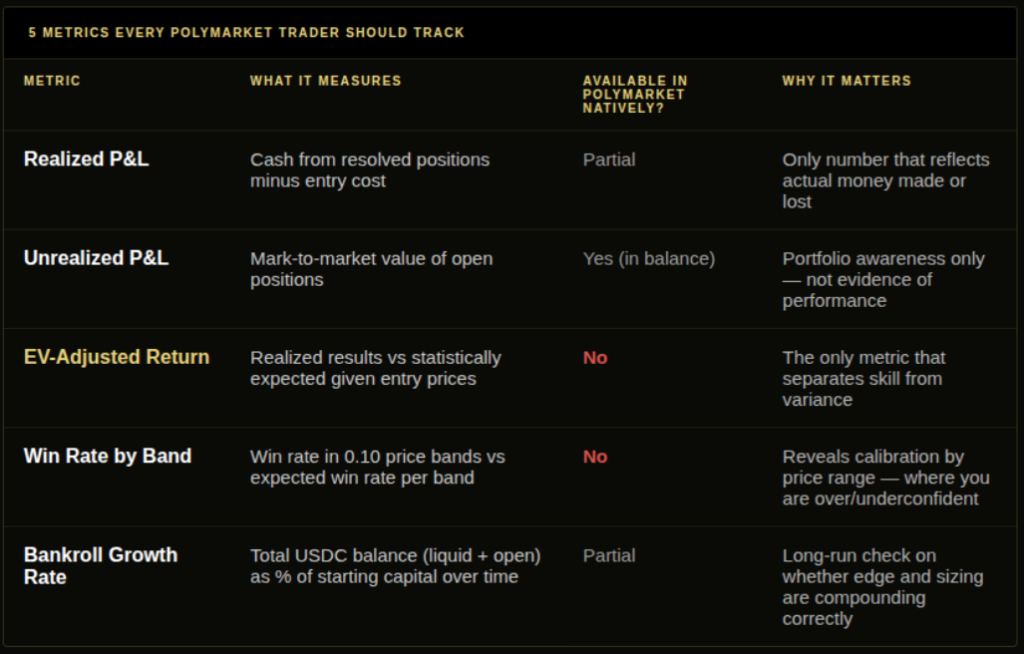
Metric 1: Realized P&L. Cash received from resolved positions minus cash paid for those positions. This is the only number that reflects actual money you have made or lost. It excludes open positions entirely. Calculate it as: sum of (resolution value minus entry cost) across all resolved markets.
Metric 2: Unrealized P&L (mark-to-market). Current market value of open positions minus entry cost. This is a snapshot, not a result. A position that shows +12 cents unrealized today can show -15 cents unrealized tomorrow if the market moves. Track it for portfolio awareness, not as evidence of performance.
Metric 3: EV-adjusted return. The most important metric. Compare your realized P&L against the expected P&L given your entry prices. For each resolved position, the expected return was: (entry price x profit if YES) minus ((1 minus entry price) x cost if NO). Sum the expected returns across all resolved positions and compare against actual realized P&L. A positive gap means you outperformed expectation. A negative gap means you underperformed. Over 100+ positions, this gap is the cleanest signal of genuine skill or its absence.
Metric 4: Win rate by probability band. Do not track overall win rate. Track win rate in bands: positions entered at 0.30-0.40, 0.40-0.50, 0.50-0.60, 0.60-0.70, and 0.70+. Compare your win rate in each band against the expected win rate (the midpoint of the band). This is calibration tracking at the level where it is useful. A trader winning 68% of their 0.60-0.70 positions is well-calibrated. A trader winning 52% of their 0.60-0.70 positions is systematically overconfident in that range.
Metric 5: Bankroll growth rate. Track your total USDC balance (liquid plus open position value) over time in absolute terms and as a percentage of starting bankroll. A trader making correct decisions with correct sizing should see their bankroll grow over time at a rate consistent with their average edge. This is the long-run check. The Calibration guide and the Positive EV Trading framework both feed into interpreting this number accurately.
How to Calculate Real Profit on Polymarket
Most traders do not track the necessary inputs to calculate real profit. Here is the minimum viable process.
For every position you take, record at the time of entry:
- Market name and resolution date
- YES or NO position
- Entry price (what you paid per share)
- Number of shares purchased
- Total USDC spent
At resolution, add:
- Resolution outcome (YES or NO)
- USDC received
- Gas paid across all transactions for this position
Real profit per position = USDC received minus USDC spent minus gas paid
Expected profit per position = shares x (entry price x (1 minus entry price)) in simplified terms – use the full EV formula from the Positive EV Trading article for accuracy.
EV-adjusted return per position = real profit minus expected profit
These numbers, tracked across 50 or more positions, start to tell you whether your edge is real. Tracked across 200, they tell you with reasonable confidence.
The Most Common P&L Tracking Mistakes
Mistake 1: Checking balance instead of tracking positions. Your Polymarket balance at any moment is not your P&L. It is your balance. It includes unrealized gains and losses, mixing open positions with settled funds. The only way to know your real P&L is to track each position from entry to resolution with the fields above.
Mistake 2: Not tracking entry price. Win rate without entry price is noise. You need to know what the market was implying at the moment you entered each position to evaluate whether your win rate reflects skill or luck. If you did not write down the entry price at the time, you cannot calculate EV-adjusted return. The entry price is not available in a useful aggregated form from Polymarket’s native interface after the fact.
Mistake 3: Treating unrealized gains as evidence of good performance. A position that is currently up 15 cents unrealized is not a winning position. It is an open position. Until it resolves, the only thing you know is that the market has moved in your direction. Markets that move in your direction also reverse. Track unrealized P&L for portfolio management, not for performance evaluation.
Mistake 4: Ignoring gas costs. Gas is a real cost that reduces your net return. Over 200 positions, total gas paid can represent a meaningful percentage of your gross profit. A trader who earns $400 in gross P&L but paid $60 in gas has a $340 net return, not $400. The Gas-Aware Betting article covers how to estimate and track this cost systematically.
Mistake 5: Drawing conclusions from sample sizes below 50 positions. A five-position winning run tells you nothing about whether your edge is real. A 50-position positive EV-adjusted return starts to say something. A 200-position record with consistent calibration across probability bands says something meaningful. Resist the urge to evaluate performance before the sample is large enough to carry statistical weight. Small samples produce enormous variance around the underlying expected value.
Building the Dataset You Need
Tracking the five metrics above manually requires a spreadsheet, discipline, and remembering to record entry prices at the moment of each trade. Most traders do not maintain this consistently, which means they reach 100 positions without the data to evaluate them.
DG3’s Portfolio screen captures position data including entry price, fair value at entry from the Fair Value Engine, and resolution outcome. The trade history accumulates as you trade, so when you reach 50 or 100 positions, the record is already there.
Cross-referencing your entry prices against resolved outcomes over time – the core of EV-adjusted return tracking – is the calculation that separates performance from correct probability estimation versus performance from variance.
Frequently Asked Questions
Q: Why does Polymarket P&L sometimes look wrong? A: Three reasons. The displayed balance includes unrealized gains from open positions, making it look higher than your actual settled profit. It does not separate cash on hand from open position value clearly. And it does not deduct gas costs paid on Polygon for each trade. The true net return from your Polymarket trading requires position-level tracking that the native interface does not provide.
Q: What numbers should every prediction market trader track? A: Five metrics: realized P&L (settled positions only), unrealized P&L (open position mark-to-market), EV-adjusted return (realized results versus statistically expected results given entry prices), win rate by probability band (not overall win rate), and bankroll growth rate over time. Without EV-adjusted return and win rate by band, you cannot distinguish skill from variance.
Q: How do you calculate real profit on Polymarket? A: Real profit per position = USDC received at resolution minus USDC spent at entry minus gas paid for all transactions on that position. This requires tracking entry price, shares purchased, USDC spent, and gas costs at the time of each trade. Reconstructing this information after the fact from Polymarket’s native interface is difficult; tracking it in real time is the correct approach.
Q: What is EV-adjusted return? A: EV-adjusted return is the difference between your actual realized P&L and the expected P&L given your entry prices. If you bought YES at 0.55 and the position resolved YES, your realized profit was 0.45 per share. The expected profit at entry was (0.55 x 0.45) minus (0.45 x 0.55) = 0. Wait – the correct EV calculation is (your estimated probability x profit) minus (loss probability x cost). EV-adjusted return compares what actually happened to what was mathematically expected at the moment you entered. A consistently positive EV-adjusted return over 100+ positions is evidence of genuine edge.
Q: How does DG3 fix Polymarket P&L gaps? A: DG3’s Portfolio screen records entry price, fair value at entry from the Fair Value Engine, and resolution outcome at the position level. It builds calibration data automatically as you trade, making the five-metric tracking framework available without a separate manual spreadsheet. The EV-adjusted return calculation in DG3 compares realized results against what the market implied was statistically expected at entry.
Q: How do I see all my Polymarket trades in one place? A: Polymarket’s interface shows recent trade history. For complete historical data, on-chain transaction records on Polygon (via Polygonscan or similar) provide the authoritative record of every transaction linked to your wallet. DG3’s P&L Tracker aggregates this into the position-level view needed for performance analysis.
Q: Is Polymarket P&L tracking different from regular trading P&L? A: The core metrics are the same – realized profit, unrealized exposure, and return on capital. What makes Polymarket tracking distinct is the importance of EV-adjusted return, which requires recording the market-implied probability at the time of each entry. In traditional trading, you compare returns against a benchmark. In prediction markets, you compare results against what the market mathematically implied was statistically expected. That comparison is what tells you whether your trading is skill-based.
Q: How do you track Polymarket performance over time? A: Record entry price, shares, USDC spent, and gas cost for every position at entry. Record resolution outcome and USDC received at resolution. Calculate realized P&L and EV-adjusted return for each position. Aggregate by probability band to track calibration. Track total bankroll (liquid plus open position value) weekly. Review calibration data every 50 positions and adjust if you see systematic overconfidence or underconfidence in specific price ranges.
Final Thoughts
The traders who improve on Polymarket are the ones who track the right numbers, not the most numbers.
Your balance tells you where you are. EV-adjusted return tells you why you are there and whether you will be in a better place in six months. Win rate by probability band tells you which parts of your market selection and probability estimation are working and which are not.
None of these numbers appear by default in Polymarket’s native interface. Building the tracking habit is the work that turns trading experience into genuine skill development. Without it, every 100 positions you trade is a repeat of the same experiment with no feedback loop.
The data is already there in every trade you make. The question is whether you are capturing it.
Sign up now – DG3 Terminal
Also read:
Calibration in Prediction Markets: How to Measure Forecast Accuracy
Positive EV Trading: A Practical Framework for Prediction Markets
Kelly Criterion for Prediction Markets: Sizing Positions When Odds Move