Calibration in Prediction Markets: How to Measure Forecast Accuracy
You went 4 for 5 last month. It felt like proof you had figured something out. Then you actually ran the math on your probability estimates instead of just your win rate, and the number told a different story. Being right is not the same as being calibrated, and most traders never learn the difference until it costs them.
Calibration is the actual test of whether your probability estimates mean anything, and it has nothing to do with whether your last few positions won.
Table of Contents
Quick Answer
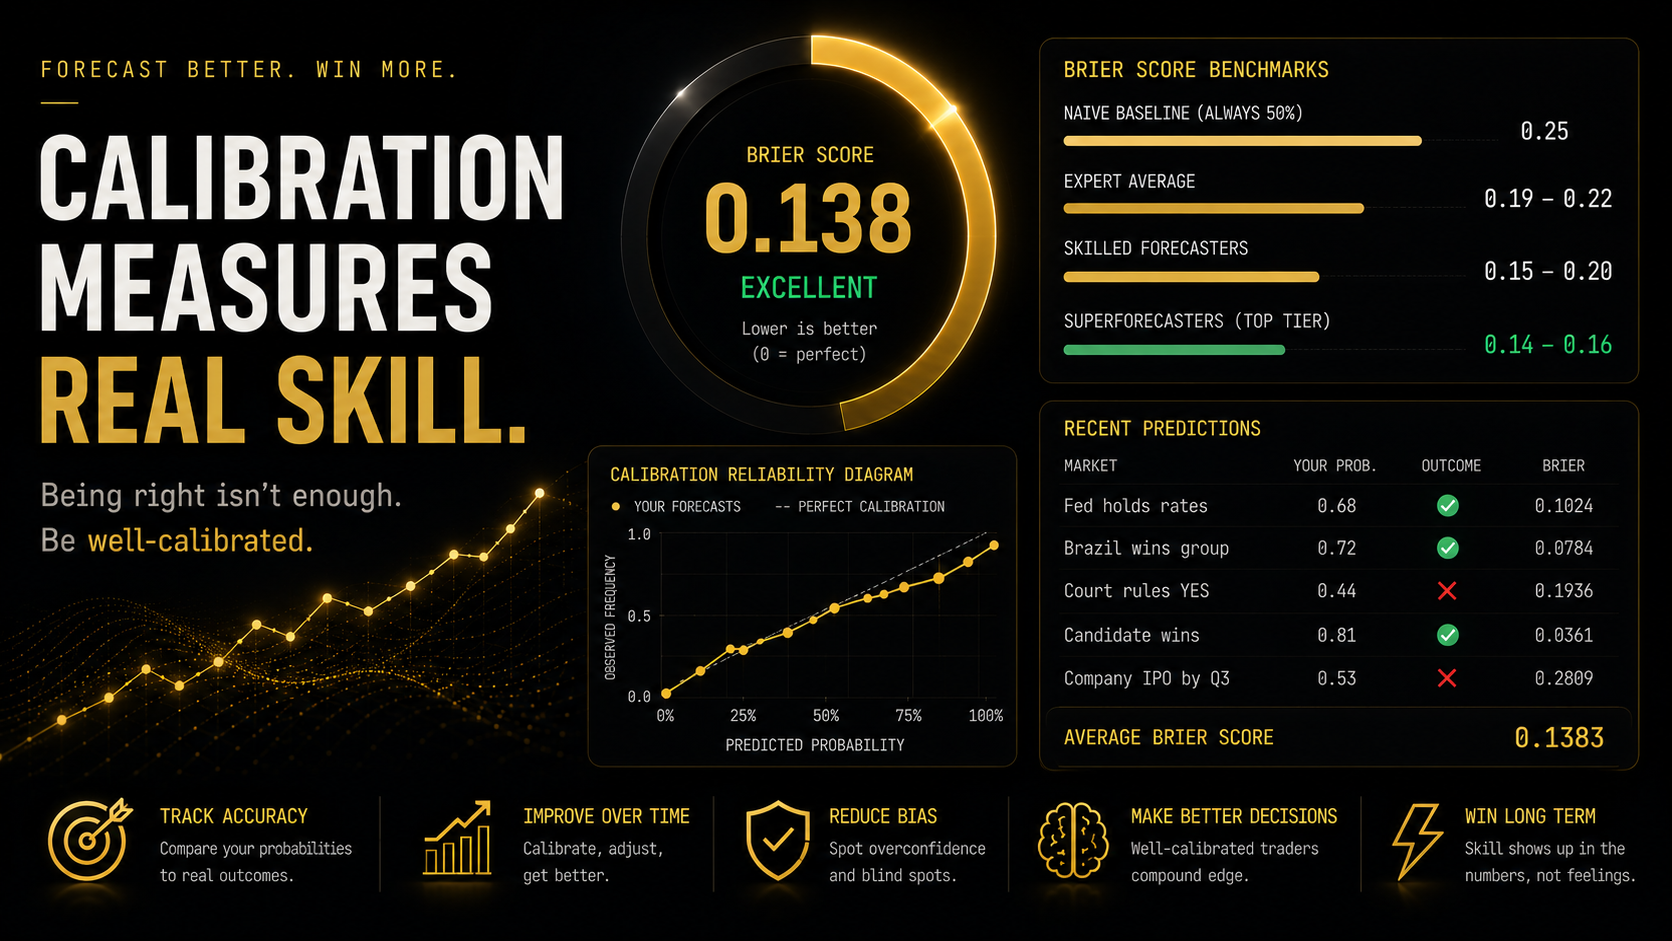
Calibration measures whether your stated probabilities match real-world outcome frequencies over time, most commonly scored with the Brier score, which ranges from 0 for perfect calibration to 1 for maximally wrong. A naive baseline that always predicts 50% scores 0.25. Skilled forecasters typically land between 0.15 and 0.20, and top-tier superforecasters studied in Philip Tetlock’s Good Judgment Project reach roughly 0.14 to 0.16. Calibration requires a meaningful sample, since five positions tell you almost nothing and two hundred tell you a great deal.
What Is Calibration in Prediction Markets?
Calibration: The degree to which your stated probability estimates match the actual frequency of outcomes over a large enough sample of predictions.
A well-calibrated trader who says “70% chance” across a hundred different positions should see those events resolve YES roughly seventy times. If they resolve YES ninety times, the trader was underconfident. If they resolve YES fifty times, the trader was overconfident. Neither error shows up in a single position. Both show up clearly at scale.
This distinction matters more in prediction markets than almost anywhere else, because the platform hands you a built-in way to check yourself. Every position you take comes with a probability estimate attached to the price you paid, and every market eventually resolves to a known outcome. Few other domains offer that clean a feedback loop.
How to Measure Forecast Accuracy: The Brier Score
The Brier score is the standard tool for measuring calibration. For a single prediction, it is calculated as the squared difference between your stated probability and the actual outcome, coded as 1 for YES and 0 for NO.
Formula: Brier score = (forecast probability – outcome)²
A forecast of 0.90 on an event that resolves YES scores (0.90 – 1)² = 0.01, a very good result. The same 0.90 forecast on an event that resolves NO scores (0.90 – 0)² = 0.81, a very bad result, appropriately punishing high confidence on the wrong side.
Reference points for interpreting your average score across many predictions:
- Naive baseline, always predicting 50%: 0.25
- Skilled forecasters: approximately 0.15 to 0.20
- Philip Tetlock’s superforecasters, top tier: approximately 0.14 to 0.16
- Expert average across political scientists and analysts: approximately 0.19 to 0.22
| Position | Your Probability | Outcome | Brier Contribution |
| Brazil wins group stage | 0.68 | YES (1) | (0.68-1)^2 = 0.1024 |
| Court rules YES | 0.44 | NO (0) | (0.44-0)^2 = 0.1936 |
| Candidate wins primary | 0.81 | YES (1) | (0.81-1)^2 = 0.0361 |
| Company IPO by Q3 | 0.53 | NO (0) | (0.53-0)^2 = 0.2809 |
The average Brier score across those five positions comes out to 0.1383, which on its own looks like a genuinely strong result. Across two hundred positions, a score that low would be real evidence of skill. Across five, it is a single data point wearing the costume of a conclusion.
4 Signs of Miscalibration
You are consistently surprised by outcomes you called “likely.” If events you priced at 75% or higher keep resolving NO more often than one time in four, your confidence at the high end is not matching reality, and the gap is worth quantifying rather than shrugging off.
Your win rate and your average implied probability diverge. If you win 60% of your positions but your average stated probability across them was 75%, you were systematically overconfident even though the win rate alone looks respectable.
You cannot remember your probability estimate after the fact. If you are not writing down a specific number before you take a position, you cannot measure calibration at all, and vague post-hoc confidence (“I was pretty sure”) is not a substitute for a logged figure.
Your calibration looks fine in aggregate but breaks down by category. A trader can be well-calibrated overall while being badly overconfident specifically on longshot political markets and badly underconfident on liquid sports markets. Aggregate scores can hide category-specific blind spots.
What Separates Lucky Traders from Skilled Ones?
Short-run results and long-run skill are different things, and the sample size problem is the reason so many traders confuse the two. A trader who wins four out of five coin flips looks skilled over that sample. They are not. The variance at five trials is enormous, and outcome-based confidence built on small samples is close to worthless as evidence of anything.
Calibration tracking solves this because it does not wait for a large enough sample of wins and losses. It compares your stated probabilities directly against outcome frequencies, which converges toward a meaningful signal faster than raw win rate does, though it still requires real volume, generally upward of fifty to a hundred tracked predictions before the number is trustworthy.
The practical implication: if you have made twenty prediction market trades and you are convinced you have found real edge based on your results, you likely do not have enough data yet to know that. Calibration tracking over a larger sample is the only way to separate a genuine skill from a lucky run that happened to feel like one.
Common Mistakes
The most common one is judging yourself by win rate alone, which ignores the confidence level attached to each call. Winning 80% of positions you called “80% likely” is calibrated. Winning 80% of positions you called “95% likely” is a problem the win rate alone will never show you.
Sample size compounds the problem. Five, ten, even twenty positions are not enough to say anything reliable about your calibration, since the variance at that scale swamps the signal, and most traders drawing conclusions this early are really just reading noise.
Then there is the logging failure that makes everything else moot: not writing down your probability estimate before entry. Without a specific number at the time of the trade, you cannot honestly reconstruct your calibration later, because memory reconstructs confidence to match outcomes after the fact, which defeats the entire purpose of measuring it in the first place.
Two more patterns are worth naming. Calibration drifts. Treating it as a one-time check rather than an ongoing practice means a calibration score from a year ago tells you very little about your current accuracy in a market you only recently started trading. And averaging everything together hides more than it reveals. Category-level blindness, where you are excellent at sports markets and consistently overconfident on political ones, or the reverse, disappears entirely in an aggregate score that only looks fine because the two errors cancel out on paper.
The Feedback Loop Most Traders Skip
Calibration tracking requires discipline most traders do not maintain on their own: logging a specific probability at entry, tracking the resolved outcome, and running the Brier score calculation across an accumulating sample. DG3’s position history captures your entry price – your implied probability at the time of the trade – against the final resolution of every closed position.
That gives you a running calibration record without the manual spreadsheet work most traders abandon after a few weeks. Seeing how your entry prices compare against resolved outcomes over time, broken down by market category, surfaces the specific blind spots described above well before they cost meaningful capital.
Frequently Asked Questions
Q: What is calibration in trading? A: Calibration measures whether your stated probability estimates match real-world outcome frequencies over a large enough sample. A well-calibrated trader who says “70% chance” repeatedly should see those events resolve YES roughly 70% of the time.
Q: What is a Brier score? A: It is the squared difference between your forecast probability and the actual outcome, coded as 1 for YES and 0 for NO. Lower scores indicate better calibration, with 0 being perfect and 0.25 matching a naive coin-flip baseline.
Q: How many predictions do I need to measure calibration accurately? A: Generally upward of fifty to a hundred tracked predictions before the Brier score becomes a trustworthy signal rather than noise. Five or ten predictions carry too much variance to draw real conclusions from.
Q: What is the difference between calibration and resolution in forecasting? A: Calibration measures whether your stated probabilities match outcome frequencies. Resolution measures how much your forecasts vary and discriminate between likely and unlikely events, since a forecaster who always predicts 50% can be perfectly calibrated but has zero useful resolution.
Q: What did Philip Tetlock’s Good Judgment Project find about superforecasters? A: The project identified a small group of forecasters whose Brier scores, roughly 0.14 to 0.16, consistently outperformed both average forecasters and, in many cases, intelligence community analysts with access to classified information, largely due to disciplined calibration practices.
Q: How do I track my own calibration as a prediction market trader? A: Log your specific probability estimate at the time of every position, record the resolved outcome, and calculate your Brier score across an accumulating sample, ideally broken down by market category rather than only in aggregate.
Q: What is overconfidence in prediction markets? A: It is a pattern where your stated probabilities at the high end, typically above 80%, resolve YES less often than the stated confidence implies, indicating your probability estimates are systematically too extreme relative to reality.
Q: Can a trader have a good win rate but poor calibration? A: Yes. A trader can win most of their positions while still being poorly calibrated if their stated confidence levels do not match the actual frequency of outcomes at each confidence tier, which win rate alone never reveals.
Final Thoughts
Calibration is not a vanity metric. It is the closest thing prediction market trading has to an honest mirror, and most traders avoid it precisely because it tends to say something less flattering than their win rate does.
The traders who improve are not the ones with the best recent run. They are the ones tracking their Brier score across enough positions to see the real pattern, adjusting confidence at the specific tiers where the data shows they are consistently off, and treating a good short-term stretch as exactly what it is: not yet evidence of anything.
That gap between feeling right and being calibrated, measured honestly across two hundred positions instead of five, is the difference between a trader who actually improves and one who just gets lucky for a while.
Combine calibration tracking with sound bankroll management to make sure a well-calibrated edge actually compounds instead of getting wiped out by poor sizing.
Also read:
Edge Decay in Prediction Markets: Why Alpha Disappears
Market Efficiency in Prediction Markets: Are They Really Smarter Than the Crowd?
Why Rule-Followers Beat Gut Traders