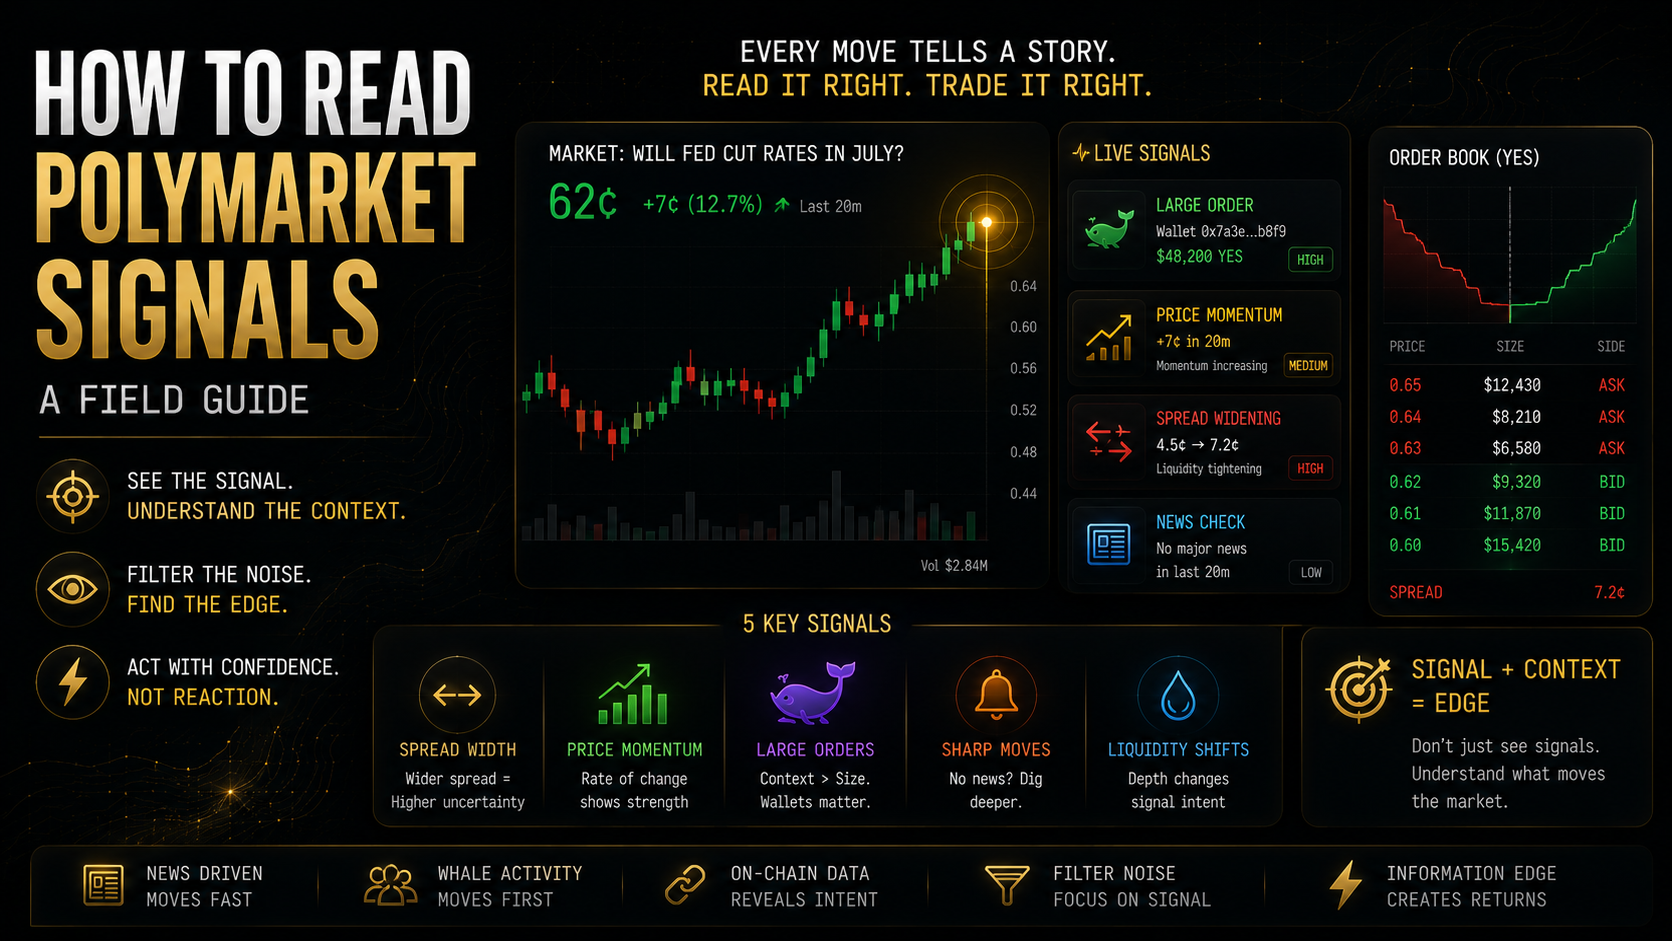
How to Read Polymarket Signals: A Field Guide
You open a market you have been watching. The price jumped 7 cents in 20 minutes. Volume is up. There is a large order in the transaction history. Your first instinct is to follow it.
Stop. The 7-cent move could mean four completely different things, three of which should not change your position at all. The traders who followed it without asking the question are what created the move. You do not want to be the liquidity they needed to exit.
Knowing how to read Polymarket signals is not about spotting movement. It is about correctly diagnosing what caused the movement before the current price already reflects the answer.
Table of Contents
Quick Answer
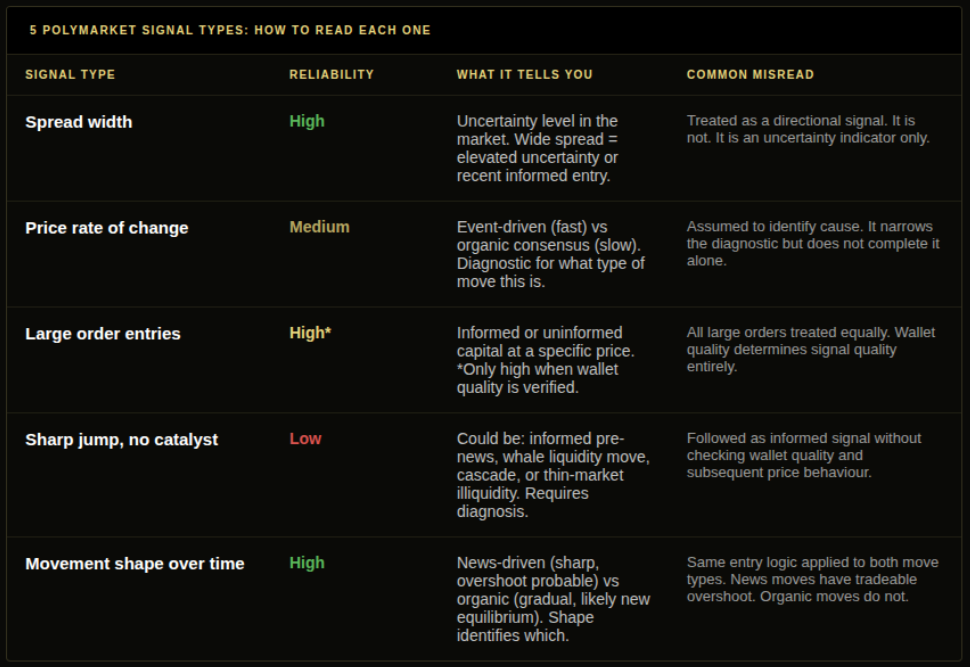
How to read Polymarket signals: classify by source before acting on direction. Five signal types matter – spread width (uncertainty indicator), price rate of change (event-driven vs organic), large order entries in the transaction history (only informative with wallet context), sharp jumps without visible news (most ambiguous signal type), and price movement shape over time (news-driven vs organic patterns). Every signal requires a source check before it becomes a trading reason. The Market Microstructure guide covers how these signals form at the structural level.
Key Takeaways
- Every Polymarket signal divides into two layers: price-side (what the market is doing) and flow-side (who is doing it and why). Price-side signals are visible to everyone and therefore mostly priced quickly. Flow-side signals are what inform probability. A trader who only reads price charts is reading the output of other people’s analysis, not the analysis itself.
- The single most common signal-reading error on Polymarket is treating all large orders as equivalent. A $40,000 YES entry from a wallet with a 68% historical win rate over 90 settled positions is a materially different event from the same dollar amount entering from an unclassified wallet. The dollar amount is visible to everyone. The wallet quality is not.
- A wide bid-ask spread is an uncertainty indicator, not a directional signal. It tells you the market is in an elevated-uncertainty state – liquidity providers have pulled quotes or widened margins because adverse selection risk is higher than normal. This warrants investigation, not immediate entry.
- News-driven price movements systematically overshoot the genuine probability update. When a market jumps 12 cents on a news event, historical patterns on liquid Polymarket markets suggest the first 7-9 cents is the real update and the remaining 3-5 cents is reactive crowd momentum. The 15-30 minute window after the initial move is where the fade opportunity sits.
- Signal interpretation is not market-agnostic. A price jump on a political market and a price jump on an NFL game have different base rate causes, different typical overshoot profiles, and different wallet quality distributions. Signal reading is most accurate in market types where you have enough domain knowledge to form baseline expectations about normal behaviour.
- The convergence test is the difference between a data point and a trading reason. An isolated whale entry is a data point. The same entry coinciding with a sharp reference book line move and a news event in the same 10-minute window is a high-confidence setup. Isolated signals should trigger investigation, not execution.
- Signal recency matters in proportion to market liquidity. On a liquid Polymarket market moving 2-3 cents per hour around a catalyst, a signal that is 45 minutes old has almost certainly been priced. On a thin market with low volume, a signal from 2 hours ago may still represent an edge. The Edge Decay guide maps exactly how fast different signal types price into different market categories.
The 5 Polymarket Signals and How to Read Each One
Signal 1: Order Book Spread Width
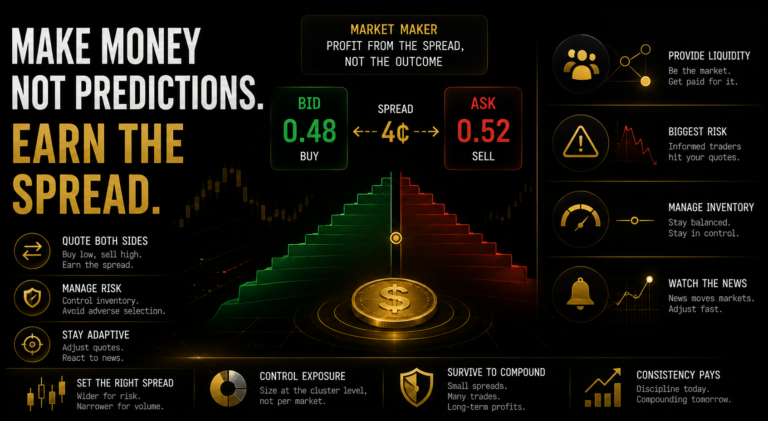
Bid-ask spread: The gap between the best available buy price (bid) and the best available sell price (ask) for YES or NO shares on a Polymarket market.
On liquid, actively traded markets, the spread is typically 0.5-2 cents. On thin markets or during periods of elevated uncertainty, it widens to 4-8 cents or more.
What it means: a sudden spread widening on a market that normally has tight liquidity means one of two things. Either liquidity providers have assessed that incoming order flow is more likely to be informed (they are protecting against being picked off), or they have no reliable probability model for an event that has become genuinely uncertain. In both cases, the spread is telling you the market is in a different state than it was an hour ago.
What it does not mean: a wide spread does not tell you which direction. This is the point most traders miss. They see a wide spread and assume something bad is about to happen to the current price. The spread only confirms that uncertainty is elevated. Whether that uncertainty resolves in your direction or against it is a separate question.
Use it as a pre-signal alert. A spread widening on a market you are tracking prompts the question. Other signals answer it.
Signal 2: Price Momentum and Rate of Change
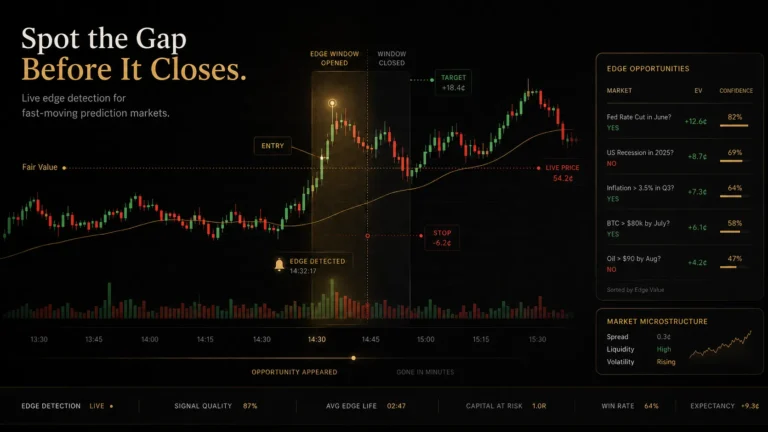
A Polymarket market that drifts from 0.52 to 0.58 over 4 hours is in a different state from one that moves from 0.52 to 0.58 in 12 minutes. The rate of change is the diagnostic.
Slow price movement (2-3 cents per hour on a market with no pending catalyst) reflects gradual consensus updating. Participants are processing available information and incrementally adjusting their probability estimates. This is the organic pattern. It is the less tradeable one because by the time you see it, most of the adjustment is already reflected.
Fast price movement (7+ cents in under 20 minutes) reflects either informed capital acting on something the market has not priced, a cascade of reactive trades following a single stimulus, or a thin-market liquidity event where a modest order moved a sparse order book. These require different responses. Only the first one is worth following.
The rate of change narrows the diagnostic. It does not complete it. Combined with the news feed and the order book transaction history, it becomes meaningful.
Signal 3: Large Order Entries
A large transaction in the Polymarket order book history is visible to every participant. The entry shows a wallet address, direction (YES or NO), size in USDC, and timestamp. On Polygon, the full transaction is on-chain and verifiable.
The interpretation problem: the dollar amount tells you nothing without wallet context.
Consider two scenarios. In the first, a $40,000 YES entry appears at 0.43 on a political market. The wallet has 93 settled positions, a 71% win rate, and a historical pattern of entering before correct probability updates. The entry is a meaningful signal that informed capital has taken a position.
In the second scenario, the same $40,000 YES entry appears at 0.43. The wallet has 3 positions, no settlement history, and no observable pattern. The entry could be a first-time participant placing their initial bet. It could be liquidity parking. It could be anything.
Most traders who follow the second scenario as if it were the first have made the most expensive signal-reading error on Polymarket.
Wallet quality is the interpretive layer that converts a visible transaction into a usable signal. Without it, large orders are data, not signal.
Signal 4: Sharp Price Jumps Without a Visible Catalyst
A price moves 8 cents in 5 minutes. No news event is visible in the feed. No obvious external catalyst. This is the most ambiguous signal on Polymarket and the one that costs the most when misread.
Four possible causes, each with completely different implications:
Informed capital acting before news becomes public. The news event is imminent and someone with earlier access has taken a position. The price jump is genuine information. Following it is the right call, and the edge is in getting in before the remaining gap closes.
A whale entering for reasons unrelated to the event’s probability. Portfolio rebalancing, liquidity provision setup, or hedging against a correlated position elsewhere. The price moved but the probability did not. Following it means buying into a temporary price dislocation that will correct.
A cascade. One large order moved the price, which triggered momentum entries from traders who saw the move and assumed it was informed. The subsequent orders are chasing, not leading. The original order may have been noise. The cascade looks like conviction.
Thin-market illiquidity. A $3,000 order in a market with $18,000 in total volume and a sparse order book produces an 8-cent move that has nothing to do with information. The market is just thin.
How to distinguish: check the order book transaction history for wallet quality on the initial order, check the news feed for any event in the 30 minutes around the jump, and then watch the subsequent 20-30 minutes. A jump that holds and continues with further orders is more likely genuine. A jump that reverses after the initial order, with no news correlation, is almost certainly noise.
Signal 5: News-Driven vs Organic Price Movement Shape
Two price charts can look identical at coarse resolution but represent completely different market dynamics. The shape of the movement distinguishes them.
News-driven moves are characterised by a sharp initial spike, elevated volatility in the 10-20 minutes following as the crowd processes the news, a tendency to overshoot the genuine probability update by 3-5 cents on liquid markets, and then a partial correction as more analytical participants assess whether the initial move was proportionate. The overshoot-and-correct pattern is the tradeable feature of news-driven moves.
Organic moves are characterised by a gradual slope with incremental steps. Each step reflects a small group of participants updating their probability estimate based on accumulated information. There is no single sharp initiating event. The move is more likely to represent the genuine new equilibrium because it is the product of many independent assessments rather than one reactive wave.
The practical implication: a 6-cent news-driven move and a 6-cent organic move call for completely different responses. The news-driven move warrants a wait-and-assess before entry, plus a potential fade entry if the overshoot is measurable. The organic move warrants immediate position evaluation, because the gradual consensus has likely priced it already.
A trader who enters both types of 6-cent moves with the same logic is systematically leaving money in the news-driven fade and losing it to the already-priced organic move. The Sharp Money vs Public Money guide covers how to track which type of capital is driving each move.
A Signal-Reading Workflow
Most traders who ask how to read Polymarket signals think about it reactively. They notice something and try to interpret it under time pressure. The traders who use signals consistently tend to run the process the other way.
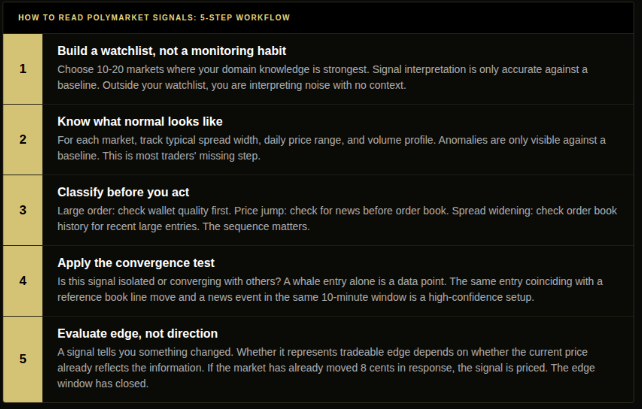
Step 1: Build a watchlist, not a monitoring habit. You cannot give useful attention to all Polymarket markets simultaneously. Pick the 10-20 markets where your domain knowledge is strongest and your probability model is clearest. Those are the markets where your signal interpretation will outperform the crowd. Everywhere else, you are interpreting noise with no baseline.
Step 2: Know what normal looks like. For each market on your watchlist, know the typical spread width, the normal daily price range, and the expected volume pattern at different points in the event cycle. You cannot identify anomalies without a baseline. This is most traders’ missing step.
Step 3: Classify before you act. When a signal fires: if it is a large order, check wallet quality before anything else. If it is a price jump, check for contemporaneous news before checking the order book. If it is a spread widening, check the order book history for recent large entries before assuming market uncertainty. The order of the checks matters because each check either confirms or dismisses the next.
Step 4: Apply the convergence test. Is this signal isolated or is it converging with other signal types? A whale entry coinciding with a reference book line move and a news event in the same 10-minute window is a high-confidence setup. Three independent signals pointing in the same direction is meaningfully different from one signal pointing in the same direction. An isolated signal is a reason to watch. Convergence is a reason to act.
Step 5: Evaluate edge, not direction. A signal tells you something changed. Whether the change represents a tradeable edge depends on whether the current price already reflects the information the signal carries. A $40,000 informed whale entry is not edge if the market has already moved 6 cents in response. The entry was the signal. The price is now the new reality. Bayesian Updating covers the correct process for updating your probability estimate when a new signal arrives.
Common Mistakes
Mistake 1: Following a price jump without checking the transaction history first. The single most expensive signal-reading habit on Polymarket. You see the 7-cent jump, the instinct is to act, and you click through before looking at who made the initial order. Afterward, when the price reverses, you find out it was an unclassified wallet moving a thin market with a $4,000 order. The wallet quality check takes 60 seconds. The reversal costs real money. Every price-movement-triggered entry should start with the transaction history, not the chart.
Mistake 2: Treating order book depth as a fill guarantee. The order book shows depth at current prices. It does not show how fast liquidity providers will pull their quotes when a large informed order hits. On thin Polymarket markets, apparent depth can vanish before a single large order completes its fill. The spread width is the better real-time indicator of actual available liquidity. A quoted 200-share depth at 0.56 with a 5-cent spread is a very different fill environment than 200 shares at 0.56 with a 1-cent spread.
Mistake 3: Applying news-driven logic to organic moves, and vice versa. A 6-cent move on a breaking news event and a 6-cent organic move over 4 hours are not equivalent trading situations. The news move has a systematic overshoot probability and a 15-30 minute fade window. The organic move has likely already priced by the time you see it. Entering both with the same logic means you are over-trading news corrections and under-reacting to genuine momentum. The shape of the move is the diagnostic. Train your pattern recognition on which shape means which.
Mistake 4: Reading signals on markets outside your domain knowledge. Signal interpretation depends on prior expectations. If you have no baseline expectation for what normal price movement looks like on an Australian cricket market, you cannot identify anomalies. A 3-cent move before a match is either routine or informative depending on context you can only have if you have followed the market. Restrict high-conviction signal-based entries to market types you know well enough to have formed a baseline. In new market types, signals prompt research, not trades.
Mistake 5: Building a global signal feed instead of a position-specific one. A feed of all large Polymarket orders across all markets is noise at scale. The same events filtered to the 15 markets on your watchlist are meaningful. Signal density has to be matched to analytical capacity. More signal volume without more interpretive capacity means more reactive decisions, not better ones. The quality of your signal feed matters less than the quality of your baseline for each market the feed covers.
The Data Layer That Closes the Gap
Raw Polymarket signal reading has one structural problem: the data is publicly visible but unclassified. Transaction histories show wallet addresses with no quality context. Price charts show movements with no event linkage. Order books show depth with no interpretation of whether the depth will hold.
DG3’s Intelligence pane addresses this at the market level. When a market is selected in the Edge Finder, the Whale tab shows recent large wallet entries with transaction context visible alongside the order book. The Book tab shows current depth and spread in real time. The Chart tab shows price history at granularity that lets you assess whether a move is news-driven or organic based on shape, not just magnitude.
The Edge Finder itself does the pre-filtering that most traders do manually and inconsistently: markets are ranked by EV gap in real time, which means the markets with the largest divergence between current price and fair value appear at the top. If a signal has already been priced, the EV gap will have closed and the market will have dropped in the ranking.
The combination removes two of the worst friction points in signal reading: the time it takes to check whether a signal is still live (Edge Finder ranking), and the time it takes to check order flow context on the initiating order (Whale tab in the Intelligence pane).
Frequently Asked Questions
Q: How do you read Polymarket signals? A: Classify by source before acting on direction. For order flow signals (large entries), check wallet quality first. For price signals (jumps or momentum), check for contemporaneous news before checking order flow. Apply the convergence test: an isolated signal prompts investigation, converging signals from multiple independent sources prompt action. Never let price direction alone drive entry.
Q: How do you distinguish noise from genuine signal on Polymarket? A: Three filters in order: source quality (for order flow, what is the wallet’s historical accuracy), recency (how old is the signal relative to the current market price (on liquid markets a 45-minute-old signal may already be fully priced)), and convergence (is this signal aligned with other independent signal types or isolated). A large order from an unclassified wallet with no news correlation and no reference book movement is noise until proven otherwise.
Q: What does a whale entry look like in the Polymarket transaction history? A: A single large USDC amount at a specific price and timestamp, with an on-chain wallet address visible and verifiable on Polygon. The size relative to total market liquidity indicates potential market impact. The wallet address is the interpretive key: a wallet with a long history of settled positions and a documented win rate is meaningful. An unclassified wallet with no history is not.
Q: How do you read a sharp price jump on Polymarket? A: Start with the transaction history for the window of the jump. Was it one large order, multiple orders, or gradual accumulation? Check the news feed for any events in the 30 minutes around the jump. Then watch the subsequent 20-30 minutes of price action. A jump that originated from a historically accurate wallet, coincided with a news event, and held at the new level is genuine. A jump that reversed after the initial order, with no news correlation and an unclassified wallet, is noise.
Q: What is the difference between news-driven and organic price movement? A: News-driven moves are sharp, show elevated volatility in the 10-20 minutes following, tend to overshoot the genuine probability update by 3-5 cents on liquid markets, and partially correct in the 15-30 minutes following the initial spike. Organic moves are gradual, reflecting incremental consensus updating. Organic moves are more likely to represent the genuine new equilibrium. News-driven moves often have a tradeable overshoot correction.
Q: Why does spread width matter as a signal? A: A wide spread on a normally tight market means liquidity providers have assessed that incoming order flow is more likely to be informed, and they have widened their margins to protect against adverse selection. It is a signal of elevated uncertainty. It does not indicate direction. It does indicate that something has changed in the market’s information state and that further investigation is warranted before entering.
Q: When should you not act on a Polymarket signal? A: When the signal is isolated with no convergence from independent signal types. When the wallet quality is unknown for an order flow signal. When the signal is more than 30-45 minutes old on a liquid active market (the edge may already be priced). When the price has already moved sharply in the signal’s direction and your entry would be chasing rather than leading. When you are in a market type outside your domain knowledge and have no baseline for what normal looks like.
Q: What is the convergence test for Polymarket signals? A: Convergence is when two or more independent signal types point in the same direction on the same market in a short time window. A whale entry is a data point. A whale entry that coincides with a reference sportsbook line move and a news event in the same 10 minutes is a convergent setup. Each additional independent signal type that aligns increases the probability that the move reflects genuine information rather than noise.
Q: How do you spot large wallet activity on Polymarket without a premium tool? A: Open the transaction history for the specific market you are monitoring. Large USDC amounts stand out relative to the typical order size for that market. The on-chain wallet address is visible and verifiable on PolygonScan. Cross-referencing the wallet against its previous Polymarket positions takes 3-5 minutes manually. The interpretive question is whether the wallet has a settled position history that demonstrates accuracy, not just activity.
Q: How fast does a Polymarket signal price in? A: Varies by market liquidity and signal type. On liquid markets with over $500,000 in volume, a whale entry or news event typically prices within 5-15 minutes as multiple participants act simultaneously. On thin markets with under $50,000 in volume, a signal can remain in the price for 30-90 minutes before the broader participant pool responds. Signal recency matters in inverse proportion to market liquidity.
Final Thoughts
Signal reading is a calibration skill, not a lookup table. The first twenty times you follow a sharp price jump on Polymarket, you will be right some of the time. The information that builds into an edge comes from tracking what type of signal it was, what the subsequent price action showed, and whether your interpretation proved correct.
A trader who has followed 50 large-order signals and recorded their outcome by wallet quality tier, news correlation, and market liquidity has a calibrated model. A trader who followed 50 signals without recording outcomes has accumulated experience without extracting the learning.
The signals on Polymarket are free and visible to everyone. The baseline knowledge to interpret them correctly is not. That baseline is built position by position, market by market, over time. Start with the markets you know. Build the record.
For the complete signal architecture across all six signal categories, read Trading Signals That Actually Move Event Markets.
Also read:
Trading Signals That Actually Move Event Markets
Sentiment Analysis for Event Markets: Separating Noise From Signal
Information Asymmetry: Who Knows What, and When, in Event Markets