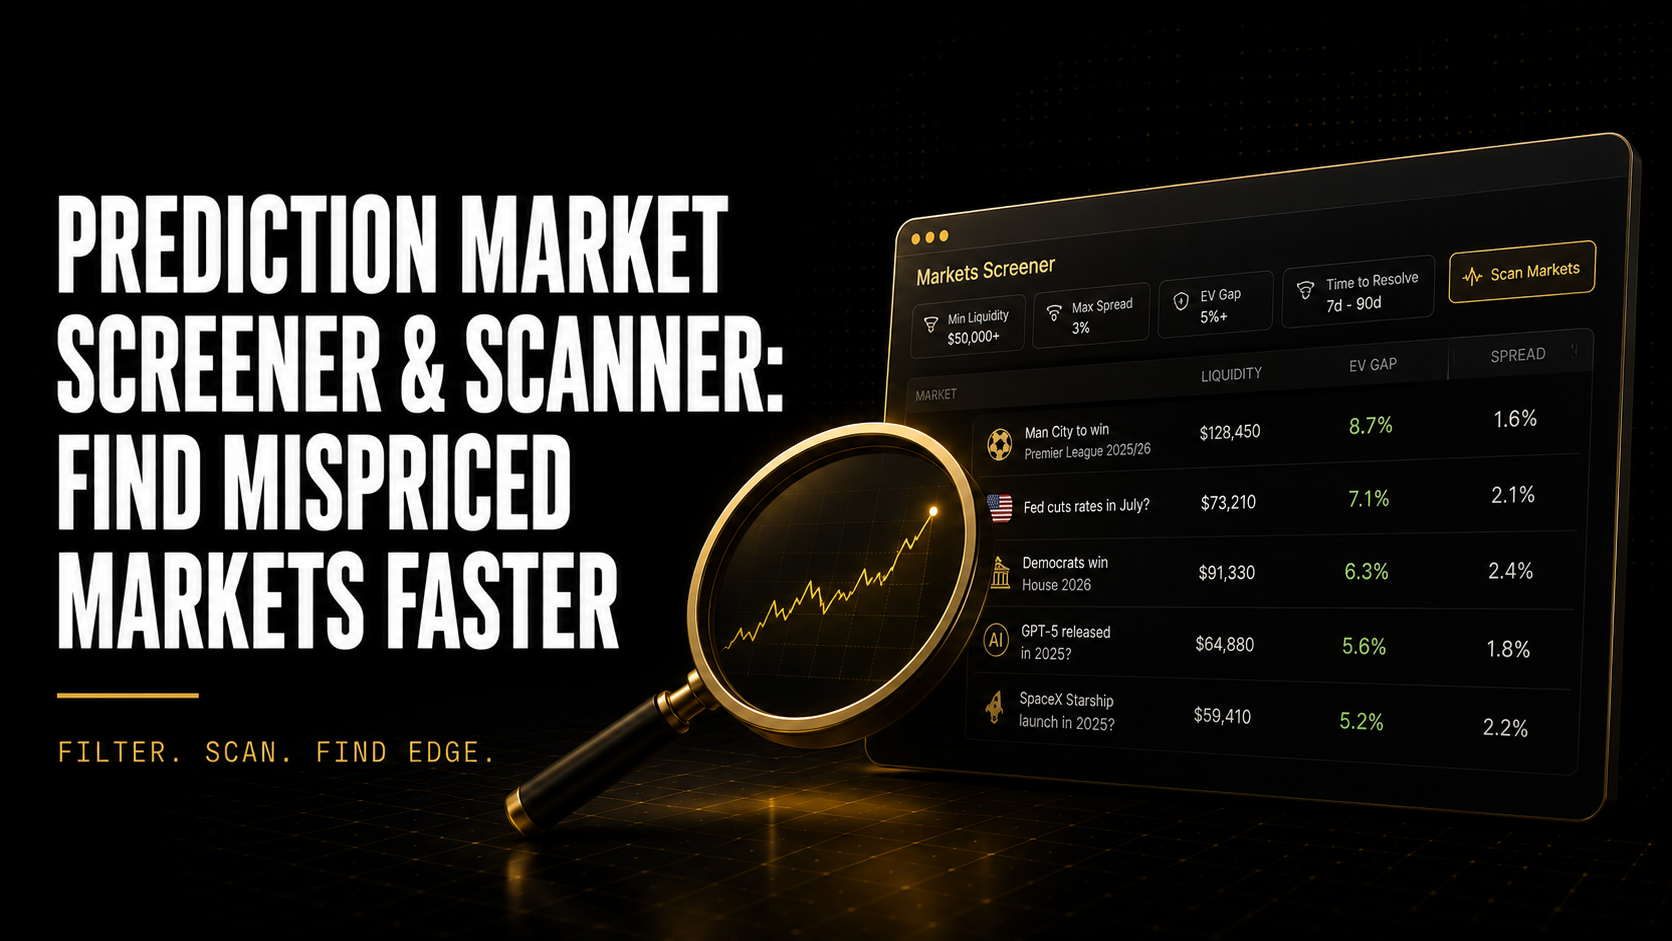
Prediction Market Screener: 5 Proven Filters for Edge
There are 400 active markets on Polymarket right now. You have time to research 6 of them properly before the market closes. A prediction market screener solves this problem. Without one, you are either missing the best opportunities or spending 40 minutes on research for a market where the edge is 0.8 cents.
The difference between traders who find consistent edge and those who find occasional edge is almost always in the discovery layer. How do you decide which of 400 markets is worth 30 minutes of your attention?
Table of Contents
Quick Answer
A prediction market screener filters active markets by liquidity, spread, and EV gap to surface the handful worth researching. A scanner runs that same filter continuously, flagging new candidates the moment conditions change. EV gap, the difference between the current price and fair value, is the most useful screening criterion for active traders because it measures the mispricing directly instead of guessing at it through volume.
Key Takeaways
- A screener is a filter you run once. A scanner is a filter that never stops running. That distinction matters most when a mispricing opens because of breaking news and closes again within 10 minutes.
- Volume is the filter most traders reach for first and the weakest predictor of tradeable opportunity. High-volume markets are watched by everyone, which is exactly why they correct fastest. Markets sitting between $50,000 and $300,000 in volume often hold a mispricing longer, simply because fewer systematic traders are watching them.
- EV gap needs a fair value benchmark to mean anything. A market with a 9-cent gap is worth researching ahead of a market with a 1-cent gap, all else equal, but only if the benchmark behind that number actually has coverage for the market you’re looking at.
- A watchlist monitors what you already found. A scanner finds what you haven’t looked at yet. Confusing the two is why traders keep missing opportunities sitting just outside their existing coverage.
- Stacking filters beats using one alone. EV gap by itself surfaces plenty of markets whose gap is large for the wrong reasons: thin order books, near-resolution noise, or gaps in benchmark coverage. Add minimum liquidity and a resolution window and the noise drops fast.
- The best filter configuration depends on what you trade. A trader focused on pre-kickoff sports windows wants sport type, kickoff time, liquidity, and EV gap. A trader chasing breaking news wants price velocity as the primary trigger, not a static filter.
- Screening finds candidates. It does not find edge. The probability model, the reference comparison, and the convergence test still decide whether a screened market is actually a trade.
What Is a Prediction Market Screener?
A prediction market screener applies your filters to every active market and returns a ranked list of the ones that clear the bar. The usual filters: minimum liquidity, maximum spread, market category, time to resolution, and EV gap.
Think of it as a stock screener rearranged for prediction markets. Manually clicking through 400 markets takes hours and still misses whatever changed since you last checked. A screener applies the same criteria to all of them at once and hands you a short list.
The filters themselves aren’t the edge. Every trader has access to the same filters. What separates one trader from another is what happens after the list appears: the probability model, the domain knowledge, and how fast you can act once you’ve decided a candidate is real.
Screener vs. Scanner
A scanner is the same idea running continuously. It watches every active market against your criteria in real time and surfaces a candidate the moment it qualifies, whether because a price gap opened or a new market got listed.
A team sheet drops at 12:15. The match winner market moves 9 cents in the next minute. At 12:16 the gap between the current price and the fair value benchmark has widened from 1 cent to 7 cents. A screener you last ran at noon missed this entirely. A scanner catches it while the gap is still open.
If you trade around scheduled catalysts, real-time scanning isn’t a nice-to-have. It’s the only way the opportunity reaches you before someone faster closes it.
The 5 Screener Filters That Actually Matter
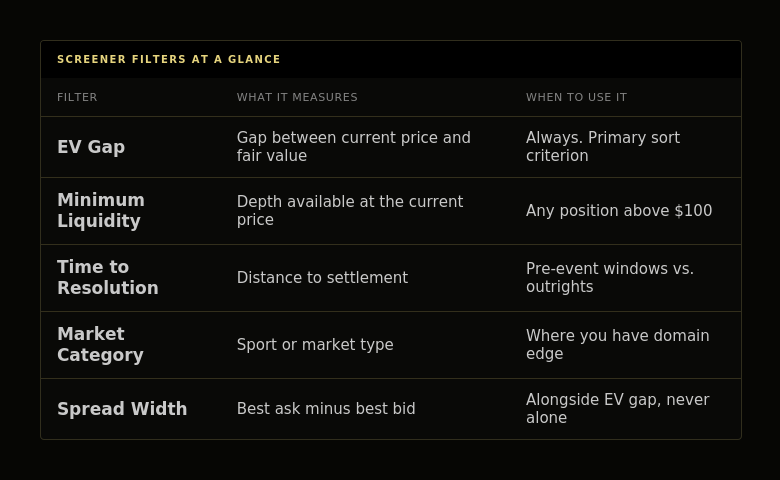
EV Gap is the primary sort. It’s the gap between the current devigged market price and a fair value benchmark, measured in cents. A 9-cent gap is a bigger divergence than a 2-cent gap. Use a minimum threshold of 3 to 4 cents, roughly the smallest edge that survives the 2% fee. Below that, most candidates aren’t worth the research time.
Minimum Liquidity filters out markets too thin to hold a real position. A market can show a 15-cent EV gap on $8,000 of total volume and still only support a $120 position before your own order closes the gap. Rough starting points: $15,000 minimum for positions under $500, $75,000 for positions up to $2,000, $250,000 for anything larger. These aren’t fixed. Check order book depth at your actual price even after the volume filter passes.
Time to Resolution splits into two use cases. Markets resolving in 0 to 72 hours reward traders tracking team sheets and injury news, the highest-signal window for sports markets. Markets resolving in 7-plus days, tournament outrights and season-long bets, hold structural mispricing longer and reward a model-based approach over real-time tracking.
Market Category keeps you inside your own expertise. A Premier League specialist screens for soccer. An NBA trader screens for basketball. The filter isn’t about limiting exposure. It’s about concentrating attention where your baseline read is actually calibrated, because signal without domain knowledge just produces false positives.
Spread Width tells you the implicit cost sitting on top of the platform fee. A 10-cent spread means you enter 5 cents above mid and exit 5 cents below it, a 10-cent round trip before fees. Pair spread with EV gap and the real picture appears: a 9-cent gap on an 8-cent spread nets out to roughly 1 cent. The same 9-cent gap on a 2-cent spread nets out to roughly 7 cents. Same gross number, very different trade.
Here’s how the five stack in practice. Say a soccer outright shows an 8-cent EV gap, $180,000 in total volume, a 4-cent spread, and resolves in 36 hours. Run it through the filters one at a time. The EV gap clears the 4-cent minimum easily. The volume clears a $75,000 floor for a mid-sized position with room to spare. The spread eats 2 cents off the gross gap, leaving roughly 6 cents net, still well above the minimum viable edge after fees. The 36-hour window puts it inside the pre-event research zone where team news is most current. Four filters, four passes. That’s a candidate worth 20 minutes of your attention. A market with the same 8-cent gap on $12,000 of volume and a 9-cent spread fails two of the four checks before you’ve opened a single chart.
Screener vs. Watchlist: Why the Difference Matters
A watchlist monitors markets you already flagged as interesting. Add Brazil’s World Cup outright to it and you get price updates for that one market. You’re not finding anything new. You’re checking on something you already decided mattered.
A screener works across the full universe of markets. When the EV gap on Argentina’s outright jumps from 2 cents to 8 cents after an injury report, your screener surfaces it even though you weren’t watching it five minutes earlier.
The two aren’t competitors. The screener populates the watchlist. The watchlist then handles entry timing and exit decisions on whatever the screener already confirmed was worth tracking.
Traders who skip the screener and run a watchlist alone tend to keep trading the same six or seven markets they already understand well. That’s comfortable, and it’s also a ceiling. The edge sitting in market number 214, the one you’ve never opened because you didn’t know it existed, never shows up on a watchlist you built from memory. It only shows up on something that’s looking at all 400.
Common Mistakes
Sorting by volume instead of EV gap. High-volume markets get watched by the most people, which means they get corrected the fastest. Sorting by volume shows you the busiest markets, not the ones with the most edge left in them. Sort by EV gap with a liquidity floor underneath it. A high-volume market with a real EV gap beats a high-volume market with none.
Using one filter alone. EV gap by itself flags plenty of markets with a wide gap for reasons that have nothing to do with a genuine mispricing: an ultra-thin order book, a market drifting toward resolution where the “gap” is just settlement noise, or a category the benchmark barely covers. Stack EV gap with minimum liquidity and a resolution window and the list gets short fast, in a good way.
Treating the screener’s output as a signal to trade. The screener tells you what to research. It never tells you what to buy. Skipping your own probability estimate because a market sits at the top of the ranked list is following the filter’s output instead of your own model, and it’s the fastest way to turn a good tool into a bad habit.
Ignoring how the time window changes the list. A screener set to a 0 to 24 hour window during a quiet week for major sports returns markets that clear the filter for the wrong reason, structural thin-market gaps instead of genuine pre-event windows. Check your filter configuration against what’s actually on the calendar before trusting the output.
Running a manual screener when the window is 10 minutes wide. Breaking-news mispricings often close inside 15 minutes. A screener you refresh by hand every half hour misses most of them by design. If your edge depends on speed, you need something watching continuously, not a manual habit you remember to repeat.
How DG3 Helps
Every filter above lives inside DG3’s Edge Finder, the terminal’s signal surface. Markets are ranked by EV gap in real time, grouped by event or league, with filter, sort, and a flatten-list view built in. The gold EV badge (+N.N¢) renders only when the Signal API has coverage for that specific market. Absence isn’t an error. It just means the benchmark hasn’t priced that one yet.
Each market row shows the outcomes, the current prices, and a meta line with volume, liquidity, and spread together, so the liquidity and spread filters above are visible without opening a second screen. When a team sheet drops and a match winner market reprices, its EV gap shifts within seconds and the row climbs the ranking on its own. You don’t have to be watching that specific market for it to find you.
Clicking an outcome chip on any row highlights it, loads the Intelligence column with the deeper analysis, and opens the Execution panel with that outcome and price already filled in. From there the path is short: see the market at the top of the ranking, click the outcome, review the pre-filled order, place the trade. Discovery and execution sit in the same workflow instead of two separate tools you have to reconcile by hand.
Frequently Asked Questions
What is a prediction market screener? A tool that filters all active prediction markets by criteria you set and returns a ranked list of candidates worth researching. Common filters include minimum liquidity, maximum spread, time to resolution, market category, and EV gap.
How does a prediction market scanner work? A scanner monitors every active market against your criteria continuously and surfaces new candidates the moment conditions change, whether a price gap opens on breaking news or a new market gets listed. Unlike a manual screener, it catches time-sensitive windows as they open rather than only at your next manual refresh.
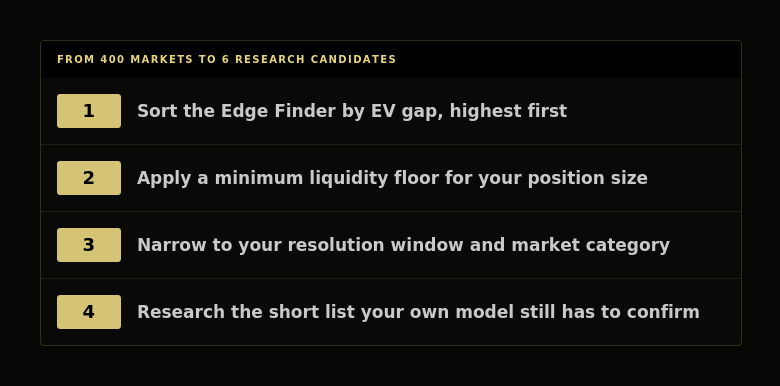
What filters find the best markets? EV gap as the primary sort, with a minimum threshold around 4 to 5 cents. Add a liquidity floor sized to your position, a resolution window matched to your strategy, and a category filter matched to your actual expertise. Stacking all four turns hundreds of candidates into a short list worth your time.
How does DG3’s Edge Finder rank markets by EV? Every active Polymarket market gets an EV badge when the Signal API has coverage for it. Markets are sorted by that value in real time, with the largest gaps appearing at the top of the ranked list. Coverage is partial by design. A missing badge means the benchmark hasn’t priced that market yet, not that anything is broken.
What’s the difference between a screener and a watchlist? A screener discovers markets across the full universe that meet your criteria. A watchlist monitors markets you’ve already identified. The screener feeds the watchlist candidates you didn’t know about. The watchlist then manages entry and exit timing on whatever you’ve already confirmed.
What’s the best prediction market scanner right now? DG3’s Edge Finder is a complete implementation of the concept for Polymarket: real-time EV ranking across every active market, liquidity and spread visible on every row, and direct execution from the same screen through the Execution panel.
Final Thoughts
The screener does not give you the edge. It gives you the list.
The edge comes from the probability model that tells you which items on that list are genuinely mispriced against your own calibrated view, the domain knowledge that lets you read a team sheet faster than the aggregate market, and the speed to act before the window closes. Polymarket’s own market resolution documentation is worth reading once if you haven’t, since half of screening well is knowing exactly what you’re being asked to price.
A trader with a good screener and a weak probability model researches a lot of candidates and enters a lot of negative-edge positions with false confidence. A trader with a sharp model and no screener finds the right markets too slowly and misses most of the time-sensitive ones anyway.
Both are gaps. Closing one without the other still leaves you short. Start with the screener to fix discovery. Build the model to turn that discovery into an actual edge.
Also read: How to Find Mispriced Markets on Polymarket
The Best Polymarket Tools in 2026: What Serious Traders Are Actually Using
Edge Decay in Prediction Markets: Why Alpha Disappears
Market Efficiency in Prediction Markets
Inside Edge Finder