Closing Line Value in Prediction Markets: The Only Honest Scoreboard
You made money last month. Twelve positions, nine winners. 75% win rate. You feel good about it.
Here’s the question that actually tells you whether you’re good: did you consistently buy at prices below where those markets closed?
That’s what closing line value prediction markets research is built to answer – not whether you won, but whether the market moved your way before the outcome was ever known.
Win rate says you were right more than wrong. CLV says whether the market agreed with you before resolution. Only one of those two things tells you if your edge is real or if you got lucky.
Table of Contents
Quick Answer
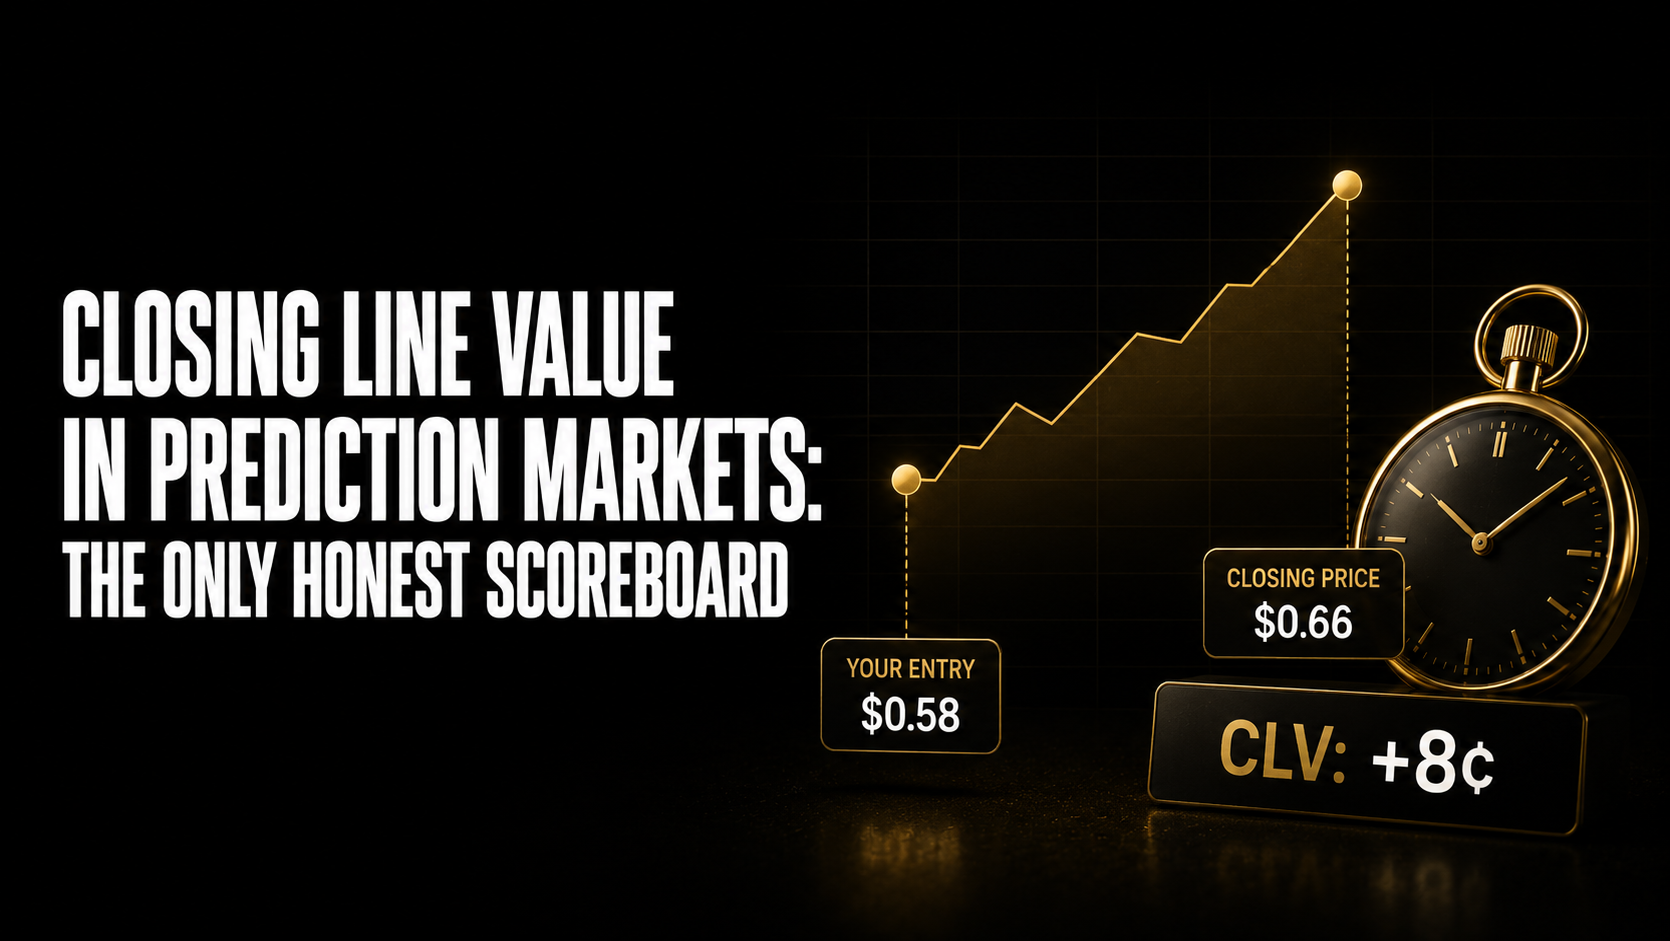
Closing line value prediction markets analysis measures the gap between your entry price and the market’s final price before resolution. If you consistently buy YES at $0.58 and those markets close at $0.66, your average CLV is +8 cents, meaning the market moved in your favour before the outcome was known. Positive CLV over a large sample is the most reliable evidence that your research produces genuine edge rather than variance-driven wins.
Key Takeaways
- CLV is the difference between your entry price and the closing price of the same outcome on the same market. A YES entry at $0.60 on a market that closes at $0.68 before resolution gives +8 cents of CLV. A YES entry at $0.60 on a market that closes at $0.54 gives -6 cents of CLV. The outcome of the market (whether YES or NO resolves) is irrelevant to CLV calculation.
- Among closing line value prediction markets measures, CLV outperforms P&L over short sample sizes because it separates process from outcome. You can win money through variance and have negative CLV. You can lose money through variance and have positive CLV. Over 100+ positions, positive CLV almost always correlates with genuine edge. P&L over 20 positions tells you almost nothing.
- The closing price in prediction markets, a concept well-documented by Pinnacle in the sports betting context, is not the price at market resolution, it’s the final price in the order book before the outcome is determined. For a CS2 match, the closing price is the price just before the match starts. For an election market, it’s the price just before polls close. These closing prices represent the aggregate of all available information at the latest possible moment.
- The reason CLV works as a performance metric is the same reason it works in sports betting: closing prices are the most efficient prices. The collective weight of all research, capital, and information available to the market is reflected in the closing price. Consistently entering before that price reaches the closing level means you’re finding information or making probability assessments that the rest of the market later agrees with.
- Negative CLV doesn’t always mean your process is wrong, single positions can have negative CLV due to random new information arriving after your entry. But a trader with negative average CLV over 50+ positions is systematically entering after the market has already absorbed the information they’re acting on, or entering at mispricings that aren’t real.
- The DG3 Sharps tab filters for CLV-qualified wallets specifically: 50+ resolved trades and positive rolling CLV over a 90-day window. This threshold exists because CLV is the only documented predictor of whether a large wallet entry represents informed capital or crowd money. Wallets that consistently beat the close have demonstrated research quality. Wallets that don’t haven’t.
- Tracking your own CLV requires recording your entry price and the closing price for every position. The closing price for any Polymarket market is accessible via the API event endpoint after resolution. Maintaining a simple spreadsheet with entry price and closing price for every trade gives you a CLV record that, over time, becomes the most honest assessment of your prediction market research quality.
What Closing Line Value Actually Measures in Prediction Markets
Closing line value (prediction markets): The difference between a trader’s entry price and the market’s final price before outcome resolution. Positive CLV means you entered at a more favourable price than the market eventually reached. Negative CLV means you entered after the market had already moved to price in the information you were acting on. Average CLV over a large sample is the primary measure of whether a prediction market trader has genuine edge.
The mechanics are straightforward. What requires more careful thinking is what CLV is actually measuring and why it works.
Prediction market closing prices are the most informationally rich prices those markets produce. By the time a market closes, every piece of publicly available information relevant to the outcome has been absorbed, arbitraged, and reflected in the price. The closing price is the market’s best estimate of the outcome probability given everything that was known.
When you enter a position at a price that’s lower than the closing price (for a YES position), you bought at a price the market later moved away from, toward the outcome. You were early to information or analysis the market subsequently validated. That’s exactly what edge looks like.
The insight that makes CLV powerful: outcome-based profit and loss measures whether you were right. CLV measures whether you were right before the market got there. That’s the only version of being right that constitutes skill rather than variance.
Also read: Line Movement in Prediction Markets: Reading Sharp Moves Before They Finish
The Closing Line Value Formula
The formula itself is simple:
CLV = Closing Price − Entry Price (for YES positions) CLV = Entry Price − Closing Price (for NO positions)
Positive CLV means you beat the close. Negative CLV means the close beat you.
Worked example, sports prediction market:
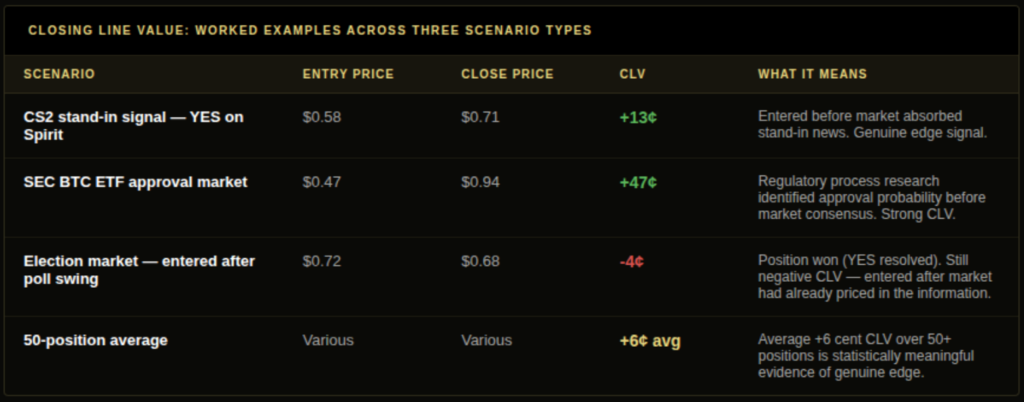
- You enter YES on Team Spirit to win at $0.58 (before team sheet publication)
- The official lineup is published: Spirit are at full strength, opponent has a stand-in
- The market closes at $0.71 just before match start
- Your CLV = $0.71 − $0.58 = +$0.13 per dollar
Worked example, regulatory market:
- You enter YES on “SEC approves Bitcoin ETF by Q1 2024” at $0.47
- The market closes at $0.94 the morning of the decision
- Your CLV = $0.94 − $0.47 = +$0.47 per dollar
Worked example, negative CLV despite winning:
- You enter YES on election outcome at $0.72 (after major polls swing)
- The market closes at $0.68 (slightly lower after further data)
- The outcome resolves YES, you profit
- Your CLV = $0.68 − $0.72 = −$0.04 per dollar
- You won money with negative CLV, you entered after the market had already priced in what you knew.
The negative CLV winning position is the category that most damages long-run performance: you’re paying for information the market already priced in, and over a large sample this pattern extracts your edge through fee drag and spreads.
Why Closing Line Value Beats P&L in Prediction Markets
Variance in prediction markets is high. Over 20-30 positions, a trader with genuine edge can lose money and a lucky trader with no edge can make money. This is not controversial, it’s basic statistics.
The problem: if you’re evaluating your performance on P&L over 20-30 positions, you can’t distinguish luck from skill. CLV cuts through this by focusing on process quality rather than outcome quality.
Consider three traders with 40 positions each. Trader A sits at 60% win rate with average CLV of +6 cents, positive CLV at meaningful sample size is strong evidence of genuine edge, and continued positive P&L is the expectation. Trader B has a 55% win rate but average CLV of -2 cents, which means they’re consistently entering after the market has already moved. The wins are variance; reversion toward breakeven is the expectation. Trader C has a 70% win rate with CLV of nearly zero, either they’re sizing on high-probability outcomes above 0.80 where CLV is structurally compressed, or they’re running positive variance with minimal real edge. More positions needed before any conclusion.
P&L tells you outcomes. CLV tells you process. Over 100+ positions the two converge, but CLV gets you to a reliable read three to four times faster.
Also read: Calibration in Prediction Markets: How to Measure Forecast Accuracy
Tracking Your Own Closing Line Value on Polymarket
Closing line value prediction markets tracking requires two data points per position: your entry price and the closing price of the same outcome. The entry price is in your trade history. The closing price requires a separate lookup.
Getting closing prices via Polymarket API: After a market resolves, the Polymarket API endpoint returns the final market prices. For each resolved CS2, sports, or political market you traded, the API gives you the pre-resolution closing price. Pair this against your entry price from your position history, and you have your CLV record.
Manual tracking process (no coding required): At market resolution, note the last traded price before the outcome was determined (visible in the market’s price history chart on Polymarket). Record: date, market, outcome you traded, entry price, closing price, CLV. A spreadsheet with these five fields gives you everything you need to calculate average CLV over time.
What to look for in your CLV record:
Positive average CLV across all positions suggests your research process generates genuine edge. Positive CLV in specific market types but negative in others suggests your edge is concentrated, adjust your activity accordingly.
If your CLV is positive on sports markets but negative on crypto event markets, you’re better at reading match dynamics than macro probability. That’s useful information. Tilt your activity toward your demonstrated edge categories.
If your CLV is consistently near zero, you’re entering positions at approximately fair value, neither finding mispricings consistently nor getting consistently exploited. You’re breaking even on edge before fees. That’s a problem worth solving before sizing up.
Closing Line Value and the DG3 Sharps Tab
The DG3 Sharps tab qualification threshold (50+ resolved trades, positive 90-day rolling CLV) exists because CLV is the only documented closing line value prediction markets measure that distinguishes informed capital from uninformed capital.
A wallet that has placed 200 trades and maintained positive average CLV over 90 days has demonstrated that it consistently enters markets before they move in its direction. That’s a genuine signal about research quality.
A wallet that placed one $50,000 order with no CLV track record is just capital without demonstrated calibration. Those two wallets look identical in raw order flow data. The CLV filter separates them.
When the Sharps tab shows a large entry on your selected market, you’re seeing a wallet that has already proven, over 50+ positions, that it finds edge before the market prices it in. That’s exactly the signal that makes large wallet entries worth weighting in your research process.
Also read: Positive EV Trading: A Practical Framework for Prediction Markets
Common Mistakes When Evaluating CLV
Mistake 1: Using win rate instead of closing line value as a primary performance metric. Win rate is almost useless as a standalone performance measure. A trader who only takes positions at $0.85 or above will have a high win rate with potentially negative CLV. A trader who identifies genuine 20-cent edges on $0.40 contracts will have a lower win rate with strong positive CLV and excellent long-run P&L. Focus on CLV.
Mistake 2: Drawing conclusions from fewer than 50 positions.
At 20 positions, a trader with genuine +8-cent average CLV can have any observed CLV from -4 to +20 cents due to variance. At 50 positions, the confidence interval narrows notably. At 100+ positions, positive average CLV becomes statistically meaningful at conventional confidence levels.
Mistake 3: Not adjusting CLV tracking for market type.
CLV on high-probability markets (above $0.80) is structurally compressed, the market can’t move much further toward the outcome. Comparing raw CLV across high-probability and low-probability positions without adjusting for contract price confuses the analysis. Track CLV separately by price range and market type.
Mistake 4: Treating a single high-CLV position as evidence of edge.
The Spirit +$0.13 CLV example above is meaningless in isolation. The stand-in announcement was public, anyone monitoring team social accounts could have entered before the close. Whether that’s edge depends on whether you consistently find these signals before the market moves, not whether you found one.
Mistake 5: Ignoring fees in CLV calculation. Your economic CLV is gross CLV minus fees. A +4-cent gross CLV position on Polymarket incurs approximately 2 cents in market order fees. Net CLV: +2 cents. That’s still positive, but barely above the viable floor. Always calculate net CLV to assess whether a pattern of trading is actually worth pursuing.
Frequently Asked Questions
Q: What is closing line value in prediction markets, and why does it matter? A: CLV is the gap between your entry price and the market’s final price before outcome resolution. If you enter YES at $0.58 and the market closes at $0.68, your CLV is +10 cents. Positive average CLV over a large sample is the primary evidence that your research generates genuine edge rather than variance-driven results.
Q: How do you calculate CLV on Polymarket? A: Entry price (from your trade history) minus closing price (from the market’s price history or API endpoint after resolution) for NO positions. Closing price minus entry price for YES positions. Record both data points for every trade and average across your position history.
Q: Why is closing line value prediction markets’ most honest performance metric? A: Because it measures process quality rather than outcome quality. Outcomes contain variance that can make skilled traders look bad and unskilled traders look good over short samples. CLV, whether you consistently entered before the market moved toward the outcome, separates skill from luck three to four times faster than P&L alone.
Q: What does it mean to consistently beat the closing line? A: It means you’re finding information or making probability assessments that the broader market later validates. The closing price reflects all available information at resolution time. Consistently entering at better prices than the close means you were ahead of that information aggregation process, which is the definition of having edge in an information market.
Q: How does DG3 track CLV automatically? A: DG3’s Sharps tab filters Polymarket wallet activity to wallets with 50+ resolved trades and positive rolling CLV over a 90-day window. This is a CLV-based filter on signal quality, it ensures that large entries flagged in the Sharps tab come from wallets that have demonstrated consistent positive CLV, not just capital without a track record.
Final Thoughts
Closing line value is the only prediction markets performance metric that’s honest about the difference between being good and being lucky.
Win rate is a story you’re telling yourself, and P&L over 15 positions is a sample too small to mean anything. The CLV record you build over 100+ positions is the one thing that tells you whether to keep doing what you’re doing or change something fundamental.
Start with your last 20 positions, calculate the CLV on each one, and look at the pattern. What you find, or don’t find, is the most useful piece of information you have about your edge.
Also read: Closing Line Value: The Number That Tells You If You’re Actually Good
Line Movement in Prediction Markets: Reading Sharp Moves Before They Finish
Calibration in Prediction Markets: How to Measure Forecast Accuracy