CS2 Kill Predictions Today: How Player Prop Markets Work on Polymarket
If you are looking at CS2 kill predictions today, ZywOo averages 23.4 kills per map against T1 opponents in the last six months. The Polymarket market has him at 0.61 to go over 21 kills in today’s match against NAVI. You’ve done the research. You know the number. The question is whether the market knows it too, and whether it knows it as precisely as you do.
CS2 kill predictions are not about guessing whether a player has a good day. They are about knowing whether the over/under line is set correctly given what you know about that player’s statistical tendencies on this map against this opponent in this format.
Table of Contents
Quick Answer
CS2 kill predictions on Polymarket take the form of binary over/under contracts on individual player kill totals across a map or series. The YES contract pays $1.00 if the player exceeds the kill threshold. The NO contract pays $1.00 if they fall short. Edge in CS2 kill props comes from map-specific player statistics, role adjustments (entry fragger vs support vs AWPer), and stand-in signals that disproportionately affect individual kill floors compared to match winner markets.
Key Takeaways
- CS2 kill prediction markets price an individual player’s kill total against a threshold. A market set at “over 18.5 kills” with YES at 0.58 means the market assigns a 58% probability the player exceeds 18 kills on this map. The threshold, not just the direction, is the critical variable.
- Map selection dramatically affects expected kill counts. An entry fragger averaging 22 kills per map on Mirage may average 16 kills on Inferno due to role differences, site structure, and their team’s tactical system. CS2 kill predictions without map-specific statistics are noise dressed as research.
- Stand-in situations affect kill predictions more severely than match winner markets. A stand-in replacing a team’s primary AWPer does not just reduce team win probability, it redistributes kill responsibilities across the remaining roster, specifically increasing the expected kills of the team’s secondary rifles. Markets take 20-35 minutes to fully price this structural shift.
- The most liquid CS2 player prop markets concentrate on the game’s top AWPers (ZywOo, sh1ro, w0nderful) and the highest-profile rifle players (NiKo, m0NESY, donk) during BLAST Premier and IEA events. Liquidity outside these players drops sharply, spreads of 12-18 cents on T2 players make clean entry pricing difficult.
- Accurate CS2 kill predictions require player-specific map statistics, not just overall averages. HLTV.org provides per-player, per-map statistics including kills per round and ADR on specific maps over selectable timeframes. A player’s overall kills per map average is a poor predictor. Their kills per map on the specific map being played is a much better one.
- Role-adjusted kill floor analysis is the most underused CS2 prop research technique. Every CS2 player has a role, entry fragger, lurker, AWPer, support, in-game leader. Role determines the minimum number of kills needed for the team to execute its system effectively, and this floor varies by map. When the kill prediction threshold is set near the role-adjusted floor, the over is systematically priced too low.
- Headshot rate and opening duel win rate are secondary variables worth tracking for AWPer markets specifically. An AWPer with a 78% opening duel win rate is generating a structurally different kill profile than one at 54%, even if their per-map average is similar.
How CS2 Kill Prop Markets Work
CS2 kill prediction market: A binary over/under contract on an individual player’s kill total in a specified match segment (single map, series, or tournament day). Resolves at $1.00 if the kill count exceeds the threshold (YES) or falls short (NO). The threshold is set by the market operator or established through initial order book equilibrium.
CS2 kill prediction markets operate identically to other binary prediction market contracts. You buy YES at the displayed price if you believe the kill total will exceed the threshold. You buy NO if you believe it will fall short. The key structural advantage over match winner markets: the outcome is completely observable during the match. Kill counts update in real time on HLTV’s live match tracker. There is no ambiguity at resolution.
The structural complication: round count variance. A player’s kills per map correlates strongly with the number of rounds played. A 2-0 map win with 26 rounds produces different kill totals than a 16-14 overtime map with 30 rounds. CS2 kill predictions set against a fixed kill threshold are implicitly also predictions about round count, series length, and map competitiveness. A player averaging 18 kills on Mirage averages those kills over the HLTV-tracked average of 27.4 rounds per Mirage map across professional play. On a 16-2 stomp, even the best player rarely hits a threshold calibrated for an average-length map.
The implication: CS2 kill prediction markets for matches with large implied win probability gaps are pricing two things simultaneously, the player’s skill level and the likely round count. When you model kill predictions, model the expected round count alongside the player’s per-round kill rate, not their per-map average.
Also read: CS2 Prediction Markets: The Complete Guide for Traders in 2026
Kill Market Types on Polymarket
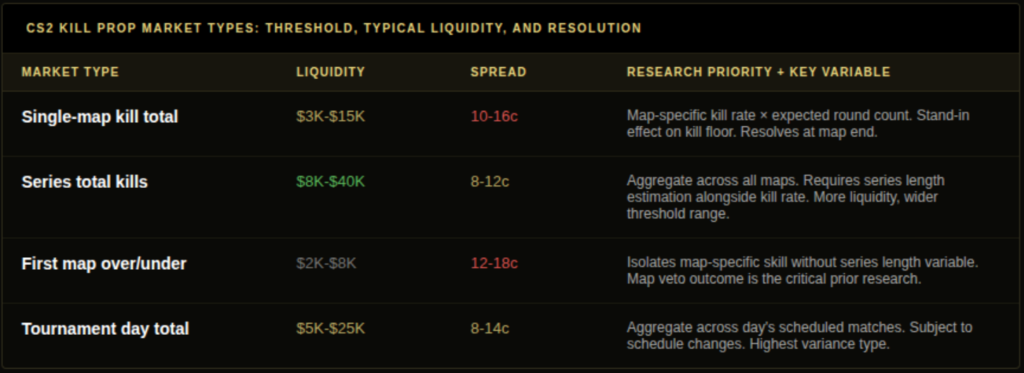
Single-map kill total: Over/under on a player’s kills on one specified map. Resolves immediately after the map concludes. Most time-sensitive CS2 prop market, liquidity concentrates in the 4 hours before the map starts and closes at map start.
Series total kills: Over/under on a player’s aggregate kills across all maps in the series. Resolves at series end. Carries more liquidity than single-map markets because the resolution timeline is longer and the variance is partially smoothed across maps. The modelling challenge is estimating both per-map average and series length simultaneously.
First map over/under: Binary contract specifically on the first map of a series. Useful for isolating map-specific player tendencies without the series length variable.
Player performance in tournament day: Some major events see markets on a player’s total kills across their day’s scheduled matches. Rare but higher liquidity when available. Subject to schedule changes.
Headshot and multi-kill markets: Occasional markets on specific performance indicators (player has a 4K or ace) exist during majors. Thin liquidity. High variance. Treated as novelty markets rather than systematic edge plays by serious participants.
Building a CS2 Kill Predictions Model That Actually Works
Serious CS2 kill prediction research follows a specific hierarchy. The information that matters, in order of predictive power:
1. Map-specific per-round kill rate. Pull the player’s kills per round on the specific map being played over the last 90 days (HLTV.org stats filter by map and timeframe). Multiply by the expected round count to get expected kill total. This is your baseline.
2. Role and team system adjustment. A T-side entry fragger’s kill rate collapses on maps where their team plays slow default setups. A CT-side AWPer’s kill rate on maps where they hold passive angles is structurally lower than on maps where they play aggressive peeks. Understand the player’s role in their team’s specific system on this map.
3. Opponent adjustment. Head-to-head statistics between the player and the opposing team’s counter-side caliber matters. A player averaging 1.18 rating overall who drops to 0.92 against T1 teams in the last six months is being modelled incorrectly by a raw average.
4. Stand-in adjustment. This is where CS2 kill props diverge most sharply from match winner markets. If the opposing team’s star AWPer is playing with a stand-in rifle player, the expected number of opening duel wins for the player you are modelling changes meaningfully, their AWP usage adjusts without a counter-AWP to worry about, increasing expected kills in aggressive peeks.
5. Expected round count. Estimate the match competitiveness. A match between two teams of similar strength on a balanced map produces more rounds (and therefore more kills) than a mismatch. Use HLTV’s implied match odds as a proxy for competitiveness.
The working formula: Expected kills = (per-round kill rate × expected rounds) × role adjustment × opponent adjustment
When the Polymarket threshold is set meaningfully above or below this expectation, the gap is your edge calculation.
Also read: Information Asymmetry: Who Knows What, and When, in Event Markets
The Stand-In Effect on CS2 Kill Predictions
Stand-in situations create some of the most exploitable CS2 kill prediction windows. The mechanism is specific and repeatable.
When Team A’s primary AWPer is replaced by a rifle stand-in, two things happen to kill distributions:
First, the stand-in player is unlikely to generate the same kill count as the player they replace. Their role is nominally identical but their actual contribution differs. A stand-in rifle playing the AWP position will produce fewer opening duels won and, critically, fewer kills per round than the primary AWPer in that role.
Second, and more importantly for kill predictions on the other team: the opposing team’s AWPer now faces a less dangerous counter-AWP. Their expected kills in aggressive peek situations increases meaningfully. This effect is systematic but the market prices it slowly, most participants update the team’s win probability directionally (“weaker team”) without modelling the second-order effect on individual player kill distributions.
This is why tracking CS2 kill predictions against historical stand-in data matters. A well-documented example from BLAST Premier Fall 2025: when Team Spirit announced a stand-in replacement for one of their maps against Vitality, the Polymarket kill prediction market for ZywOo priced an over/under at 0.59 YES for over 22 kills. The stand-in reduced Spirit’s counter-AWP capability meaningfully. ZywOo’s per-map average against Spirit’s full roster was 19.8 kills. Against their equivalent stand-in configuration in a prior match, it was 24.3 kills. The market took 23 minutes to begin moving the kill line after the announcement. The 4-5 cent window on a correctly modelled kill prediction represents a clear, specific, repeatable edge pattern.
Common Mistakes That Cost You on CS2 Kill Predictions
Mistake 1: Using overall kills per map average without map-specific adjustment. A player’s aggregate kills per map number blends Mirage, Inferno, Dust2, Nuke, and Overpass into a single average that accurately describes none of them. On a map where a player has 11 games in the last 90 days averaging 21.4 kills per map, that is your baseline. Their overall average across all maps tells you almost nothing useful.
Mistake 2: Ignoring round count variance in kill threshold modelling.
A kill threshold set at 19.5 kills is effectively pricing two outcomes simultane ously: the player’s skill level and the match lasting enough rounds for them to reach 19 kills. On a match with a clear favourite (implied 75%+ win probability), model the expected round count under the likely win scenario. A 16-8 stomp produces categorically different kill totals than a 16-12 competitive map.
Mistake 3: Applying match winner research directly to kill predictions.
The edge sources for match winner markets (team-level map win rates, referee see d) and kill prediction markets (individual player statistics, role adjustments, round count) are almost completely different. A strong match winner position does not automatically generate a correct kill prediction. The research requirements are separate.
Mistake 4: Trading kill props without checking liquidity.
A 14-cent spread on a CS2 kill prediction market means you are paying 7 cents on entry and another 7 cents on exit. For a 5-cent edge, the round-trip spread costs you more than your edge. Check the order book depth in the Book tab before entering any kill prop position with less than $20,000 in market volume.
Mistake 5: Missing the stand-in announcement timing window. Stand-in announcements for CS2 matches typically come out 12-36 hours before match start. If you are checking kill prediction markets within 2 hours of the match, the most time-sensitive stand-in edge has often already been partially priced. Build a pre-match research routine that checks both team’s official communications 24 hours before the match, not 30 minutes.
Frequently Asked Questions
Q: What CS2 kill predictions are available on Polymarket? A: Single-map over/under kill total markets, series total kill markets, and tournament-day kill total markets for major events. Markets concentrate on the game’s highest-profile players during BLAST Premier, IEA, and ESL Pro League fixtures. Availability and liquidity vary by event and player profile.
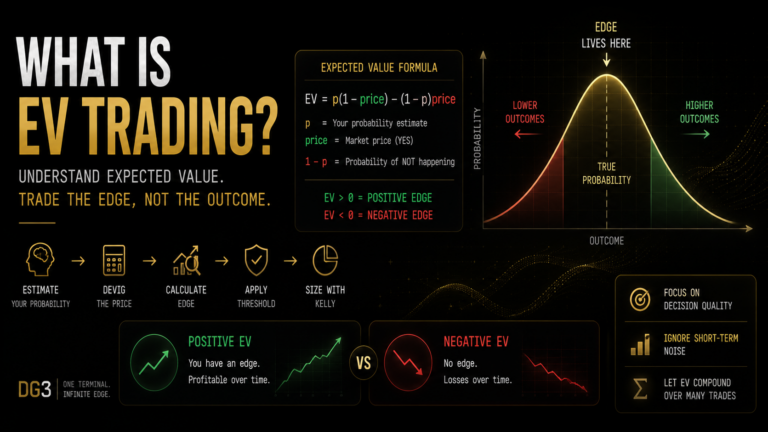
Q: How do you find edge in CS2 kill predictions today? A: Compare your model’s expected kill total (per-round kill rate × expected rounds × role adjustment × opponent adjustment) against the Polymarket threshold. Devig the current price. If your model estimates a 68% probability of the over and the devigged price is 0.54, your edge is 14 cents, notable enough to investigate further with the convergence test.
Q: How accurate are CS2 kill predictions? A: More accurate than match winner predictions at the individual map level, because kill counts are directly observable and less subject to late-match variable conditions. Less accurate than tournament outright markets, because single-match variance is high. A properly calibrated CS2 kill prediction model applied across 50+ positions in the same player/map context shows meaningful edge. A single kill prediction is high variance.
Q: Which CS2 players have the most liquid prop markets? A: ZywOo (Team Vitality), sh1ro (Cloud9/G2), donk (Team Spirit), m0NESY (G2 Esports), and NiKo (G2) typically see the deepest kill prop liquidity on Polymarket during major events. Tournament-specific liquidity depends on team performance in the event, deeper tournament runs generate more prop market volume.
Q: How does kill prediction change when a player is a stand-in? A: Two effects. The stand-in player will typically produce fewer kills than the player they replace, particularly if replacing an AWPer with a rifle stand-in. The opposing team’s AWPer benefits from reduced counter-AWP pressure, increasing their expected kills. Both effects take 15-30 minutes to fully price into CS2 kill prediction markets after the announcement.
Q: How do you trade CS2 kill props on Polymarket step by step? A: Research: pull per-map kill statistics for the player on the specific map, adjust for role and opponent quality, estimate expected round count, incorporate any stand-in effects. Calculate expected kills and compare against the threshold. Devig the current price. If the gap exceeds 4 cents after fees, calculate a Kelly-sized position. Check the order book depth before entering, spreads on kill props are often 10-14 cents on lower-liquidity fixtures.
Q: What data sources are most useful for CS2 kill predictions? A: HLTV.org for per-player, per-map statistics including kills per round, ADR, and opening duel win rates over selectable timeframes. Liquipedia for roster confirmation and stand-in announcements. Official team social accounts for real-time lineup changes. Pinnacle‘s player prop lines where available as a secondary reference.
Final Thoughts
CS2 kill predictions are the most statistically intensive form of CS2 prediction market trading. The research infrastructure, per-map player statistics, role adjustments, stand-in modelling, round count estimation, requires more preparation than match winner research. But the market is also shallower and the participant pool less sophisticated. The mispricings are larger and persist longer.
The uncomfortable truth about kill prediction markets: most people who trade them are not modelling anything. They are trading vibes, “ZywOo is playing well lately” or “donk had a bad week.” That is fine. It creates the inefficiency you are exploiting.
Build the per-map statistics database. Track the stand-in announcements. Model the round count. When the Edge Finder shows a 9-cent gap on a ZywOo kill prediction market 20 minutes after a Spirit stand-in announcement, you will already know exactly what the gap should be, because you will have done the work before the match started.
Also read: CS2 Prediction Markets: The Complete Guide for Traders in 2026
CS2 Esports Odds: How to Read, Compare, and Trade Counter-Strike Markets
Information Asymmetry: Who Knows What, and When, in Event Markets