Exposure Management: How to Stop One Event From Sinking Your Book
The US election settled on Polymarket in a single evening in November 2024. Some traders lost one position that night. Others lost eleven.
Not because they were wrong about the election. Because they were right about the election and built a portfolio around it: YES on the winner, YES on Senate control, YES on House control, YES on state-level races that tracked the same result, YES on crypto prices correlated with the outcome. Each position individually sized correctly. The aggregate resolved on the same night, in the same direction, for the same underlying reason.
Portfolio risk management in prediction markets is not about picking better markets. It is about mapping the correlation structure of your positions before the calendar resolves them all at once.
Table of Contents
Quick Answer
Exposure management in prediction markets means controlling three types of risk simultaneously: single-event concentration (multiple positions resolving on the same event), correlated exposure (positions in different markets that move on the same underlying driver), and total portfolio heat (total capital at risk as a percentage of bankroll at any moment). The solution is a four-rule framework enforced before new positions are added, not reviewed after bad nights. DG3’s Portfolio screen and Trade Desk risk controls support all four rules: exposure visibility, position tracking, and Stop-Loss and Take-Profit fields configurable per trade.
Key Takeaways
- Portfolio risk management in prediction markets is more complex than in sportsbooks because the resolution calendar clusters. Major events (elections, tournaments, Fed meetings) produce dozens of markets all resolving in the same 12-hour window. A Polymarket portfolio that looks diversified across 15 markets can have 60% of its bankroll resolving on a single Tuesday night.
- Single-event concentration builds deliberately. Correlated exposure builds invisibly. You intended the concentration on the election. You did not realise your tech earnings markets, your Fed decision markets, and your crypto milestone markets all move together on the same risk-on/risk-off macro variable until they lost simultaneously on the same bad day.
- An event-level exposure cap is the most underused risk tool in prediction market trading. An explicit rule: “no more than 15% of bankroll on any single event or directly related event cluster” catches the election scenario before it develops. Without this rule, a correctly sized position-by-position approach can still produce 50% bankroll exposure to one night’s outcomes.
- Stop-loss triggers in prediction markets behave differently from equities. A YES position going from 0.55 to 0.20 is not a stock that might recover. It is a binary contract that may resolve at 0 in 72 hours. The stop-loss question is not “will this recover” but “has the market’s probability estimate moved enough to invalidate my original thesis at this position size.”
- Kelly criterion gives you position-level sizing. It does not give you portfolio-level controls. Two correctly Kelly-sized positions on strongly correlated outcomes are not two independent risks. They are one risk expressed twice, consuming two independent Kelly fractions on the same event driver.
- DG3’s Portfolio screen tracks total exposure across all open positions in real time. The KPI stat bar shows bankroll deployment percentage and open exposure in dollars. The Exposure by Category chart groups positions by Sports, Politics, Crypto, Macro, and Other. The Risk Metrics panel shows a Correlation cluster watch count when positions share an underlying driver. The Trade Desk Full Order form includes a Risk Controls section for setting Stop-Loss and Take-Profit levels at entry time.
Why Prediction Market Exposure Management Is Different
In a traditional sportsbook, each bet resolves on a separate event on a separate day. A bettor with 20 open positions has 20 positions resolving across 20 different evenings. The natural separation of events provides implicit diversification over time.
On Polymarket, the resolution calendar does not separate events by convenience. An election cycle produces presidential, Senate, House, state, and policy markets all resolving on the same night. A FIFA World Cup produces group stage, knockout, and outright winner markets resolving across the same 4-week window. A Fed meeting produces rate decision, inflation projection, and crypto-correlated markets all moving on the same statement at 2:00 PM.
A trader who positions correctly across each individual market can find 40-60% of their bankroll resolving on a single event cluster without making a single position-sizing error. The error is at the portfolio level, not the position level. And portfolio-level errors are invisible until the event resolves.
This is the structural difference that makes explicit exposure management more critical in prediction markets than in almost any other trading context.
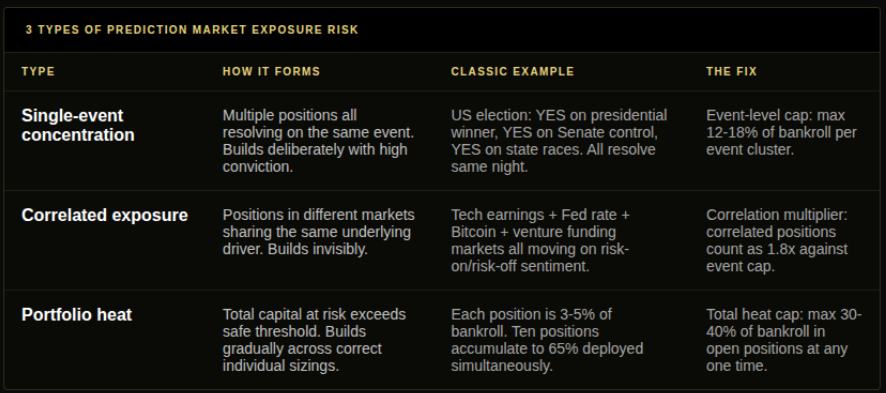
The 3 Types of Prediction Market Exposure Risk
Type 1: Single-Event Concentration
The most visible type. Multiple positions directly tied to the same event resolution.
The election example: YES on presidential winner, YES on Senate control, YES on House control, YES on state-level races correlated with the same result. Each position was entered on a different market. All resolve on the same night. The combined exposure to election night resolving a specific way: 40% of bankroll.
Fix: an event-level cap defined before the first position is entered. “I will not deploy more than 15% of bankroll on this election night’s resolution, across all markets combined.” Write it down. Enforce it before position 3, not after position 8.
Type 2: Correlated Exposure
The invisible type. Positions in markets that look unrelated but share an underlying driver.
Six positions across: a tech company earnings market, a Fed rate decision market, a Bitcoin price milestone market, a venture funding indicator, a consumer confidence market, and a tech-sector employment market. These markets have different titles, different resolution criteria, different asset classes. But they all move in the same direction when macro risk-off sentiment hits. One bad macro day and all six positions take a simultaneous hit.
Identifying correlated exposure requires mapping your positions against underlying drivers before taking them, not after they all move together. If three positions all depend on “macro risk-on environment,” they are effectively one position expressed three times. For the full mechanics of how prediction market correlations compound, the Correlated Markets guide covers it in detail.
Fix: a correlation multiplier on your event-level cap. Strongly correlated positions (sharing a primary underlying driver) count as 1.8 positions against the event cap. Weakly correlated positions count as 1.2. Two strongly correlated positions at 5% of bankroll each function as a 9% event-level exposure, not two separate 5% exposures.
Type 3: Total Portfolio Heat
The gradual type. Each individual position is correctly sized. Each event-level exposure is under the cap. But the total capital deployed across all open positions is 65% of bankroll simultaneously.
One bad week of correlated events and the drawdown is severe enough to affect decision quality on subsequent trades. Not because any individual position was wrong. Because the aggregate ran too hot for the bankroll to absorb a bad run.
Fix: a total heat monitor before adding any new position. If current total exposure is above 35-40% of bankroll, no new positions until existing ones resolve. This constraint feels frustrating on good-opportunity days. It feels like the difference between a drawdown and a catastrophic one on bad-opportunity weeks.
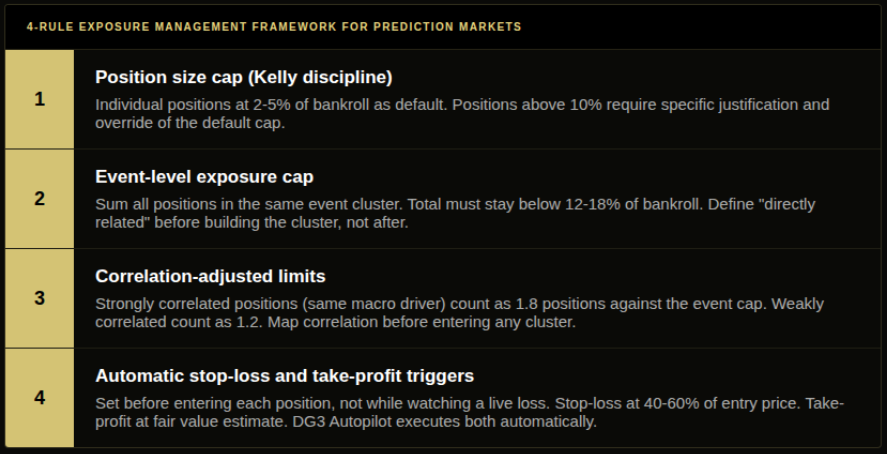
The 4-Rule Exposure Framework
Rule 1: Position size cap (Kelly discipline)
Individual positions at 2-5% of bankroll as the default. Positions above 10% require a specific reason documented before entry: an edge estimate materially above the normal range, a market with an unusually deep order book, and a correlation check confirming the position is not part of a cluster already near the event cap.
Half Kelly is the standard. Full Kelly requires exceptional confidence in your edge estimate and your calibration data. For the full sizing framework, Kelly Criterion for Prediction Markets and Bankroll Management cover the mechanics.
Rule 2: Event-level exposure cap
Before entering any position, sum all open and pending positions in the same event cluster. The total must stay below 15-18% of bankroll (adjust based on your edge quality and variance profile). Define “directly related” before building the cluster, not while you are sizing position 7.
This rule catches the election scenario. It catches the tournament outright plus group stage cluster. It catches the Fed meeting plus rate-sensitive macro cluster. The definition of “related” should be written down and applied consistently, not judged fresh each time.
Rule 3: Correlation-adjusted limits
Positions sharing a primary underlying driver count as more than their face value against the event cap. Use a multiplier:
- Strong correlation (both move primarily on the same macro or event variable): 1.8x against cap
- Moderate correlation (share a secondary driver, other independent factors also matter): 1.3x
- Weak correlation (incidentally related, primarily driven by independent factors): 1.0x
Two positions at 5% of bankroll with strong correlation count as 9% against the event cap. Three such positions at 4% each count as 21.6% — above a 15% event cap before you have added anything else.
Rule 4: Pre-set stop-loss and take-profit triggers
Set these before entering each position, not while watching a live loss accumulate. A stop-loss at a predetermined price limits the maximum drawdown on any individual position. A take-profit at your fair value estimate is your exit signal when the edge has been expressed. Both levels are set through DG3’s Trade Desk risk controls before the position opens.
The discipline requirement: set both levels before the position is open. Loss aversion will convince you to hold through a stop-loss level once you can see the loss. The stop-loss must be set when your thinking is clear, not negotiated downward as the position moves against you.
Stop-Loss and Take-Profit in Binary Markets
Prediction markets resolve at either 0 or $1. This changes the calculus for stops and targets in a specific way.
In equity markets, a position can recover from 40% down. Holding through a drawdown based on a long-term thesis is a reasonable approach. In prediction markets, a YES position at 0.20 and falling has a resolution date. If the event resolves NO, the position goes to zero regardless of how close to YES it came. There is no “holding for recovery.” There is only holding for a binary outcome.
The correct stop-loss level is not a price-based floor. It is a probability-based threshold: at what price has the market updated the true probability enough that holding the position is no longer positive EV at the original thesis size?
A YES entered at 0.55 based on a 68% model probability: if the market has moved to 0.25, the market is now pricing approximately 24.5% probability. The position has not just lost unrealised value. The market has processed information your model apparently did not reflect, and the probability case for the position has been substantially revised downward.
Price-based stop-loss levels (stop at 0.30 on a 0.55 entry) are a practical approximation when you cannot continuously re-run your full probability model. They work because sustained price movement to a level far below entry almost always reflects genuine information entering the market. Set the level in DG3’s Trade Desk risk controls before entry, accept the occasional false stop-out as the cost of the protection, and do not adjust the stop downward once the position is open.
Take-profit is cleaner: if your fair value estimate is 0.68 and the market reaches 0.68, the edge you identified has been expressed. Exit, capture the gain, redeploy toward the next edge. Holding a resolved position past fair value is not more upside. It is converting a calibrated edge-based position into a directional bet on further movement.
Common Mistakes
The election scenario is not unusual. It is the default outcome when traders position around a major event without first mapping their total event-level exposure. Each individual position decision was rational. The portfolio-level outcome was not. The mistake is sequential position-taking without a portfolio-level check at each step.
Treating position count as diversification is the second most expensive mistake. Ten positions on ten different Polymarket markets is not diversification if seven of them share the same macro driver. Count correlation, not position count.
Setting stop-loss levels while watching a live loss is the third mistake. The moment your position is at 0.38 and falling, loss aversion is active, and the stop-loss level you set will be lower than the level you would have set with a clear head before entry. Pre-set the level. Write it in your position notes before clicking buy. Enforce it without renegotiation.
Not reviewing portfolio heat before adding positions is the fourth. The check takes 30 seconds: what percentage of my bankroll is currently deployed across all open positions? If the answer is above 40%, there is no new position to add until something resolves. This rule breaks down specifically on days with multiple attractive opportunities — the days when it matters most.
How DG3 Helps
The Portfolio screen is the tool most Polymarket traders do not have. It lives at /portfolio and gives you a complete financial picture of all open positions in one place.
The KPI stat bar at the top shows five live figures: Total Bankroll, Open Exposure (the dollar sum of all open positions with the percentage of bankroll deployed), Unrealized P&L mark-to-market in real time, Realized P&L over the last 30 days, and Rewards earned from maker rebates and volume activity. The Open Exposure tile is where you check total heat before adding a new position: if it reads 38% deployed, you know where you stand before clicking anything.
The Exposure by Category chart breaks open exposure into Sports, Politics, Crypto, Macro, and Other as colored bars with dollar amounts and percentages. If you have three positions all classified under Politics, the chart groups them as a single Politics exposure figure, not three separate line items. That is the event-level concentration made visible in one view.
The Risk Metrics panel includes a Correlation cluster metric. When multiple open positions share the same underlying event or theme, the metric shows a watch count (the screen shows “3 watch” in yellow), which is the prompt to review before adding another correlated position.
The Open Positions table shows every live position with entry price, current price, cost basis, and unrealized P&L updating via WebSocket. Each row has a Close button that opens a close modal with full and partial close options.
For entry-time risk controls, the Trade Desk Full Order form includes a Risk Controls section where Stop-Loss and Take-Profit price levels are set before the order is placed. These fields record your exit levels at the moment your thinking is clear, before you are watching a live loss.
Frequently Asked Questions
Q: Why does exposure management matter more in prediction markets than sportsbooks? A: Resolution calendar clustering. Major prediction market events produce dozens of correlated markets resolving in the same window. An election cycle produces 15+ markets resolving on the same Tuesday night. A Fed meeting produces 10+ rate-sensitive markets moving on the same afternoon statement. Sportsbook bets resolve on separate matches across separate days. The clustering risk is structural to prediction markets and requires explicit caps that sportsbook bettors rarely need.
Q: What are the three types of prediction market exposure risk? A: Single-event concentration (multiple positions resolving on the same event cluster, builds deliberately), correlated exposure (positions in different markets sharing the same underlying driver, builds invisibly), and total portfolio heat (aggregate capital at risk exceeding safe bankroll deployment threshold, builds gradually).
Q: How do you set exposure limits across correlated markets? A: Map each open position to its primary underlying driver. Group positions sharing a driver. Apply a correlation multiplier (1.8x for strong correlation, 1.3x for moderate) against your event-level exposure cap. Two strongly correlated positions at 5% each count as 9% against the event cap, not 10%. Define the groupings before entering any position in a cluster, not after they have accumulated.
Q: How do stop-loss and take-profit work in prediction markets? A: In binary prediction markets, stop-loss exits when the price falls to a predetermined level, limiting loss to the distance between entry and stop rather than the full position value. Take-profit exits when the price reaches your fair value estimate. Both must be set before entering the position. Loss aversion will negotiate both levels downward once a live loss is visible. Set them while thinking is clear, enforce them without revision.
Q: How does DG3 support exposure management? A: DG3’s Portfolio screen shows Open Exposure as a live dollar amount and percentage of bankroll deployed across all open positions. The Exposure by Category chart groups positions into Sports, Politics, Crypto, Macro, and Other so event-level concentration is visible as a single figure rather than individual line items. The Risk Metrics panel includes a Correlation cluster metric that shows a watch count when multiple positions share the same underlying event or theme. The Trade Desk Full Order form includes a Risk Controls section where Stop-Loss and Take-Profit levels are set at entry, before the position is open and before emotion is involved.
Q: What is a good total heat limit for Polymarket portfolio management? A: 30-40% of bankroll in open positions at any one time as an upper bound for most systematic traders, with no single event cluster accounting for more than 15% of that total. These are starting points. Your specific limits should reflect your edge quality, your track record’s variance, and your psychological ability to maintain decision quality during a drawdown.
Q: How is prediction market portfolio risk different from traditional portfolio risk? A: Binary resolution changes the recovery calculus. In equity portfolios, a position can partially recover from a drawdown. In prediction markets, a position that resolves NO is worth exactly zero regardless of how close to YES it came before resolution. Risk management in prediction markets is therefore more about preventing total loss on correlated clusters than managing temporary drawdowns toward eventual recovery.
Final Thoughts
Exposure management is the risk layer between making good trades and making money from good trades consistently over time. You can be right about every individual position and lose a meaningful portion of your bankroll in a single event-cluster resolution. That is not bad trading. It is missing the portfolio layer entirely.
Map the correlation before you hold the position. Set the stop before you enter the market. Cap the event-level exposure before the calendar tells you the resolution date is tomorrow.
Enforcement is the hard part. A rule you plan to monitor manually will be overridden by conviction on the day it matters most. Setting Stop-Loss and Take-Profit levels in the Trade Desk Full Order form before each position opens, and checking the Portfolio screen’s Open Exposure tile before adding new positions, makes the four rules operational rather than aspirational. The cost of the discipline is one extra step per trade. The benefit is every bad-resolution-night that does not become a catastrophic one.
Also read:
Kelly Criterion for Prediction Markets: Sizing Positions When Odds Move
Correlated Markets in Prediction Markets: Managing Portfolio Risk
Bankroll Management