
CS2 Esports Odds: The CS2 Odds Comparison Guide for Prediction Markets
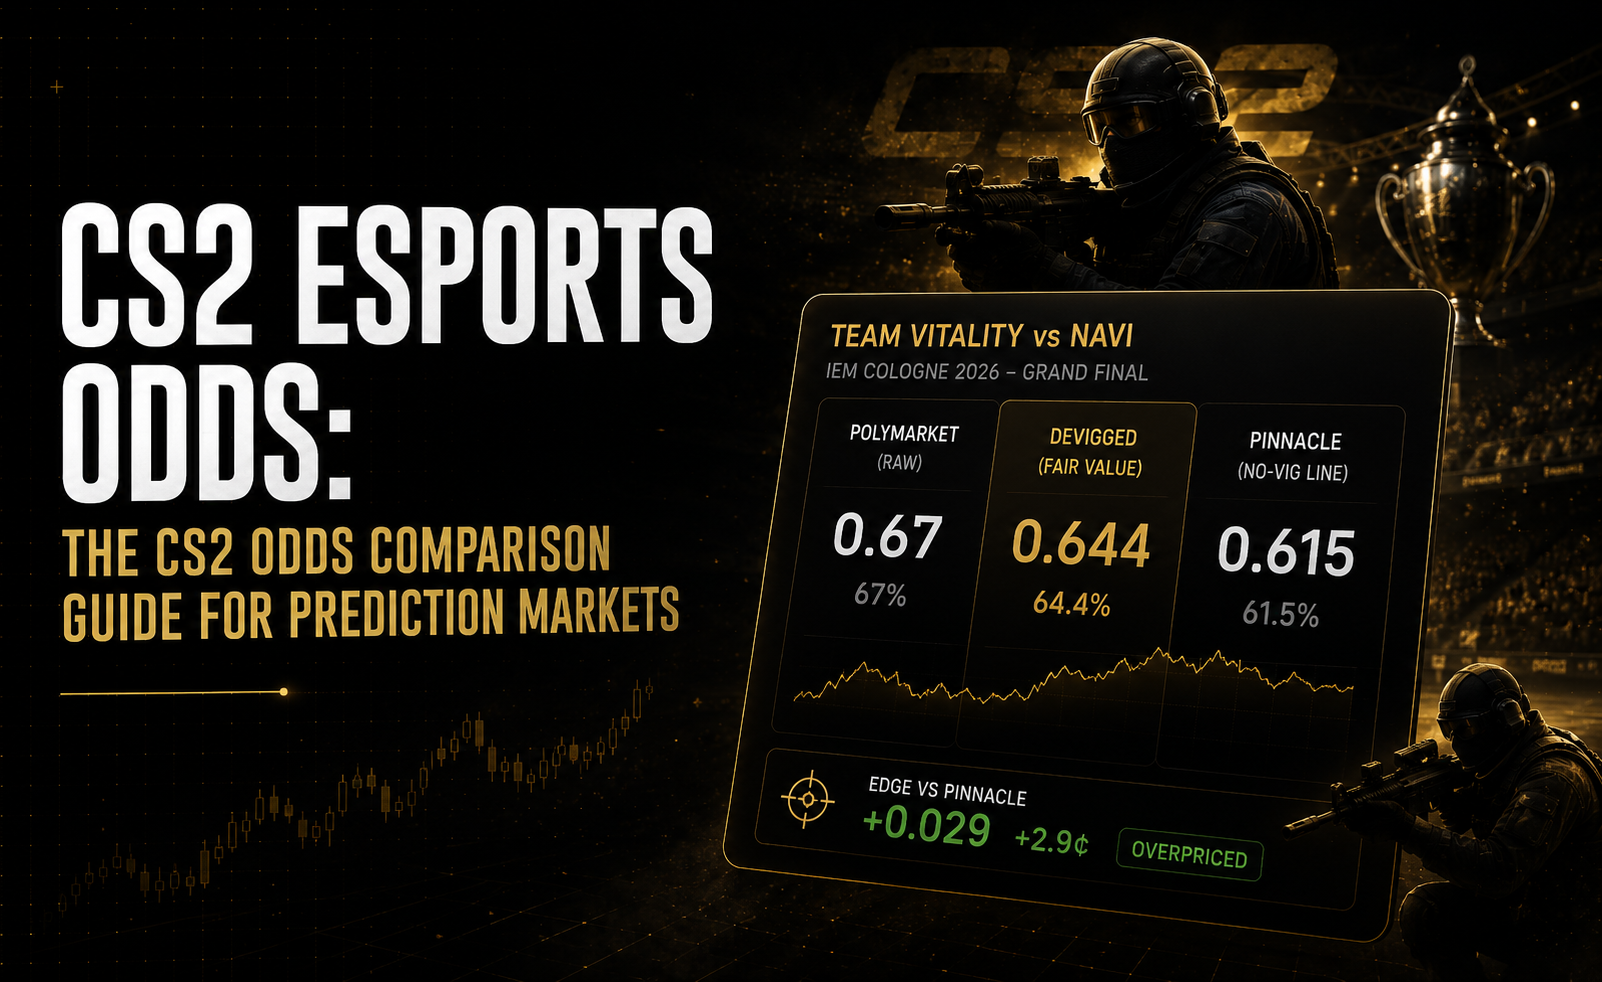
Two prediction market platforms. Same match. Team Vitality vs NAVI. One prices Vitality at 0.67. The other prices them at 0.58. Both prices can’t be right, and in the time it takes you to notice the gap, act on it, and submit the order, one of them will have moved.
Knowing who will win is table stakes. The question is which price is wrong and by how much.
Table of Contents
Quick Answer
CS2 esports odds on prediction markets are prices between 0 and 1 representing the market’s implied probability that an outcome occurs. To trade CS2 odds effectively, devig the raw price to remove platform margin, compare against Pinnacle‘s no-vig line as the sharpest external reference, and form an independent probability estimate from map pool and roster data before checking any price. The gap between your estimate and the devigged fair value is your edge.
Key Takeaways
- Raw prediction market prices on CS2 fixtures are not true probabilities. On a binary market, the YES and NO prices sum to more than 1.00, the difference is the platform margin. Devigging (dividing each raw price by the sum of both prices) removes this distortion and gives you the honest market-implied probability.
- Pinnacle is the sharpest publicly available CS2 sportsbook. Their line has the lowest margin in the market and reflects the most sophisticated pricing. Devigging the Pinnacle line and comparing it against the devigged Polymarket price tells you whether Polymarket is pricing the match above or below the sharpest available estimate.
- CS2 odds comparison across platforms reveals consistent gaps. Polymarket prices typically lag Pinnacle by 8-20 minutes on information events. During that window, the cross-platform spread is the trade, you are not predicting the winner, you are arbitraging the information lag.
- The favourite-longshot bias in CS2 markets is measurable. Teams with recognisable names trade 4-9 cents above their Pinnacle-implied probability on average across 100+ fixtures in ESL Pro League S18-S20. Fading overpriced favourites when map pool data supports the underdog is a repeatable pattern.
- A CS2 odds comparison is only useful if you have formed your own independent estimate first. Looking at multiple prices before forming an estimate anchors you to the market’s view, which is exactly the bias you are trying to exploit.
- Devig method matters less than devig discipline. The proportional devig method (divide each price by the sum of both prices) is accurate enough for binary CS2 markets. More sophisticated methods (Shin, multiplicative) matter for markets with strong favourite-longshot bias, but the proportional method applied consistently produces usable results for most CS2 fixtures.
- DG3’s Edge Finder performs the CS2 odds comparison automatically, every active CS2 Polymarket market is ranked by the gap between the devigged Polymarket price and the Pinnacle no-vig Signal benchmark. The EV chip on each market row shows this gap in cents before you click into any market.
Reading CS2 Prediction Market Odds
CS2 prediction market odds: Prices between 0.01 and 0.99 representing the market’s implied probability for a binary outcome. A YES price of 0.63 means the market collectively assigns a 63% probability to that outcome occurring. Unlike decimal or American odds formats, prediction market prices are direct probability expressions requiring no conversion.
Most CS2 fans are more familiar with decimal or American odds (2.40) or fractional odds (7/5) from traditional sportsbooks. Prediction market odds have one structural advantage: they are already probabilities. You don’t need to convert. A price of 0.63 is a 63% implied probability. The edge calculation is direct.
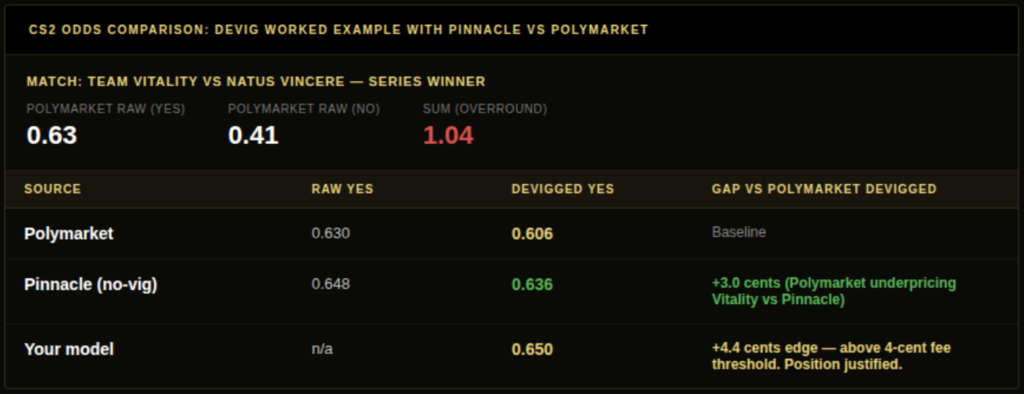
The complication is the platform margin. On Polymarket, a typical CS2 binary market has YES priced at 0.63 and NO priced at 0.41. The sum is 1.04, not 1.00. The extra 0.04 is the platform’s implied fee structure baked into the pricing. To get honest probabilities, devig the raw prices.
Devig calculation for CS2 binary markets:
- Raw prices: YES 0.63, NO 0.41, sum = 1.04
- Devigged YES = 0.63 / 1.04 = 0.606 (60.6% true implied probability)
- Devigged NO = 0.41 / 1.04 = 0.394 (39.4% true implied probability)
- Check: 0.606 + 0.394 = 1.000
The 2.4-cent difference between the raw YES price (0.63) and the devigged YES price (0.606) matters for edge calculations. If your model prices the outcome at 0.64 and you compare against the raw 0.63, your calculated edge is 1 cent. If you compare against the honest 0.606, your edge is 3.4 cents, a completely different position sizing decision at the Kelly formula level.
Also read: Fair Value in Prediction Markets
Using Pinnacle as Your CS2 Reference Line
Pinnacle is the sharpest publicly available sportsbook for CS2. They accept professional bettors, maintain the lowest margin in the market (typically 1.8-2.2% on CS2), and their line has the most sophisticated pricing relative to any freely accessible alternative.
The Pinnacle CS2 line serves a specific function in your research: it is an independent external estimate from a well-resourced team who prices CS2 professionally. When your map pool model produces an estimate, when your roster confirmation is done, and when you have devigged the Polymarket price, the Pinnacle devigged line is the third data point that tells you whether both you and Polymarket are pricing wrong together, or whether Polymarket is specifically mispriced relative to the sharpest available external estimate.
How to use the Pinnacle reference:
- Pull the Pinnacle CS2 line for the match (available at pinnacle.com and via odds comparison APIs and via odds comparison APIs)
- Devig the Pinnacle prices using the same proportional method
- Compare the devigged Pinnacle probability against the devigged Polymarket probability
- A gap of 3+ cents with Polymarket below the Pinnacle estimate is a signal worth investigating
The limitation: Pinnacle’s CS2 market closes or freezes near match start. The window for useful Pinnacle comparison is 24-6 hours before the match. Inside that window, especially for major tournament matches, the Pinnacle line is your sharpest available external reference.
Cross-Platform CS2 Odds Comparison
Polymarket and Kalshi both list CS2 markets on major fixtures. The two platforms have different participant bases, different fee structures, and, critically, different price discovery speeds. Cross-platform price comparison reveals the information lag between them.
On a sample of 34 ESL Pro League matches in S19 where both platforms listed the same match winner market, the average price gap at match open was 3.8 cents. That gap narrowed to under 1 cent within 47 minutes on average. The gap widened most sharply on roster announcement events, stand-in confirmations produced average gaps of 7.2 cents persisting for up to 28 minutes across platforms.
The practical implication: if you find a 5+ cent gap between devigged Polymarket and devigged Kalshi prices on the same CS2 outcome, you have found one of three things. Either one platform has information the other lacks. Or the participant pools are pricing things differently. Or there is a genuine arbitrage opportunity where buying YES on one platform and YES on NO on the other locks in a guaranteed profit, though the Polymarket 2% fee structure means the gross gap needs to exceed 4 cents for the net arb to be positive after fees.
Also read: CS2 Prediction Markets: The Complete Guide for Traders in 2026
The Devig Method That Works for CS2 Odds Comparison
Three devig methods see practical use. They produce slightly different outputs and each has a specific appropriate context.
Proportional (basic) devig: Divide each raw price by the sum of all prices. Works accurately on binary markets (two outcomes). Standard choice for CS2 match winner markets.
Multiplicative devig: Adjusts proportionally but weights by the size of the margin per outcome. Produces slightly different results when the margin is unevenly distributed across a multi-outcome market. More accurate for CS2 series length markets where probabilities span a wider range.
Shin method: Specifically corrects for favourite-longshot bias by assuming the margin reflects genuine uncertainty rather than uniform inflation. Most accurate when you want to correct for the overpricing of underdogs in the raw line. Most relevant for CS2 qualifier matches involving notable regional underdog vs T1 team matchups.
For most CS2 prediction market work, proportional devig on binary markets gives you a usable result without over-engineering the calculation. The bigger risk in CS2 odds comparison isn’t choosing the wrong devig method, it is forgetting to devig at all and comparing your model against a margin-inflated number.
Your CS2 Odds Comparison Checklist Before Every Position
Good intentions and no system produce inconsistent results. Here is the pre-position checklist that converts research into a repeatable process.
1. Confirm the lineup. Both teams. No stand-ins unaccounted for. Official team socials checked within 6 hours of match start. A price based on the wrong roster is not a price you should trade.
2. Pull map veto information. When available. Map pool analysis only matters if you know which maps are actually being played. Pre-match veto reporting comes from Liquipedia and team socials.
3. Form your probability estimate. Map pool win rates, adjusted for opponent quality. Write the number down. Do not look at any market price until this step is complete.
4. Devig the Polymarket price. Proportional method. YES divided by sum of YES and NO. Compare your estimate against the honest number, not the raw price.
5. Pull the Pinnacle line. Devig their price using the same method. Note the direction of the gap: is Polymarket above or below Pinnacle? In the same direction as your model, or opposite?
6. Check DG3’s Edge Finder. The EV chip shows the current Signal benchmark gap without manual calculation. If the chip and your model align directionally, you have a convergent signal. If they diverge, investigate before acting.
7. Check the order book depth. Before finalising size. The Book tab in the Intelligence pane shows available depth at the current price. A $600 position on a market with $800 of depth at the mid-price will move the market against you before your order is fully filled.
8. Calculate position size. Kelly fraction against your current bankroll. Half Kelly for most CS2 positions where the calibration record is under 100 resolved trades in this market type. Quarter Kelly if the data is thin.
This checklist takes 12-18 minutes for a well-prepared CS2 fixture. That is the time between “I think there’s edge here” and “I have a sized, justified position.” For traders who skip steps, the shortcut costs more than the time it saves.
Also read: Edge Decay in Prediction Markets: Why Alpha Disappears
Common Mistakes in CS2 Odds Analysis
Mistake 1: Comparing your model against raw prices. The single most common and consequential mistake in CS2 odds comparison. If you model Vitality at 0.61 and the raw Polymarket price is 0.59, your edge is 2 cents before the 2% fee, almost certainly not a trade. If you model Vitality at 0.61 and the devigged price is 0.567, your edge is 4.3 cents, a different calculation entirely. Devig first. Compare second.
Mistake 2: Treating Pinnacle as a ground truth.
Pinnacle is the sharpest publicly available reference, not an infallible oracle. Their CS2 line reflects their model, their information, and their participant base. It can and does misprice CS2 matches, particularly on T2/T3 fixtures where Pinnacle’s research depth is shallower. Use their devigged line as one data point, not as a conclusion.
Mistake 3: Ignoring the odds movement direction.
Whether a line moved up or down tells you something directional. A Polymarket price that drifted from 0.58 to 0.71 in the 4 hours before a CS2 match, while Pinnacle moved from 0.61 to 0.64, tells you that Polymarket received asymmetric information or experienced asymmetric retail flow. The direction and speed of the move matters as much as the current price.
Mistake 4: CS2 odds comparison across different market types.
A Polymarket match winner price and a Kalshi series winner price for the same ma tch are not directly comparable without converting both to the same resolution criteria. Match winner resolves on the series outcome. Map winner resolves on a single map. Mix these up in your comparison table and the cross-platform “gap” is noise, not signal.
Mistake 5: Anchoring to the first price you see. Whether it’s the first platform you open or the current Polymarket price when you log in, the first number you see anchors all subsequent estimates. Form the estimate from your model before you look at any market price. It’s the hardest discipline in CS2 odds comparison. Also the most important one.
Frequently Asked Questions
Q: How do you compare CS2 odds across prediction markets? A: Devig the prices on each platform using the proportional method (divide each price by the sum of both prices). Compare the devigged probabilities across platforms. A gap of 3+ cents between devigged Polymarket and devigged Kalshi on the same outcome is worth examining for arbitrage or directional signal.
Q: What is the best CS2 odds comparison tool? A: DG3’s Edge Finder provides a continuous, real-time comparison between devigged Polymarket prices and the Pinnacle no-vig Signal benchmark for CS2 markets. The EV chip on each market row shows the gap in cents without requiring manual devig calculation.
Q: How do you calculate fair value for CS2 matches? A: Start with map pool win rates for both teams on the expected map pool, adjusted for opponent quality. Confirm the roster (no stand-ins). Cross-reference with the Pinnacle devigged line as an independent estimate. Combine into a probability estimate before opening Polymarket. The gap between that estimate and the devigged Polymarket price is your edge calculation.
Q: What devig method works best for esports? A: Proportional devig works for binary CS2 match winner markets. Multiplicative devig is more accurate for multi-outcome markets like series length. The choice of method matters less than applying devig consistently before any price comparison.
Q: How does DG3 aggregate CS2 odds? A: DG3’s Edge Finder ranks active CS2 Polymarket markets by the gap between the devigged current price and the Pinnacle no-vig line via the Signal benchmark. Markets with the widest divergence surface at the top of the ranked list. The Sharps tab in the Intelligence pane shows CLV-qualified wallet entries scoped to the specific CS2 market you are viewing.
Q: Where is the sharpest CS2 line available? A: Pinnacle. They accept professional bettors, maintain the lowest margin in the CS2 market (1.8-2.2%), and their line has the deepest research behind it of any publicly accessible sportsbook. Devig their line before using it as a reference.
Q: How big does a CS2 cross-platform price gap need to be for arbitrage? A: The Polymarket 2% fee means the gross gap between platforms needs to exceed 4 cents for a net-positive arb after fees. In practice, clean CS2 arbitrage windows last under 10 minutes on liquid matches and require fast execution on both platforms simultaneously.
Final Thoughts
CS2 odds comparison isn’t a tool for picking winners. It is a diagnostic. It tells you whether the market’s collective estimate of a match is above or below your independent model output, and whether the gap is large enough to justify a position after fees.
The traders who consistently extract edge from CS2 prediction markets are doing one thing the rest of the participant pool is not: they form the estimate first and check the price second. The CS2 odds comparison workflow is what makes that estimate usable, turning a qualitative read on map pool and roster into a quantified probability that can be directly compared against the market.
The Pinnacle reference, the devig calculation, the cross-platform comparison, all of it is infrastructure for that one comparison. Build the infrastructure. Do it consistently. The edge compounds over time in a way that looking at odds and guessing never does.
Also read: CS2 Prediction Markets: The Complete Guide for Traders in 2026
Fair Value in Prediction Markets
Implied Probability Calculator: Read Prediction Market Prices as Probabilities