What Is EV Trading? Expected Value Explained
Your friend made three correct calls in a row on Polymarket and is now explaining their system to you. Your friend does not have a system. They had three wins. Those are different things. And if they keep trading the way they are trading, the results will eventually say so.
Expected value is the concept that separates one from the other. Not on a single trade. On all of them, together, over time.
Table of Contents
Quick Answer
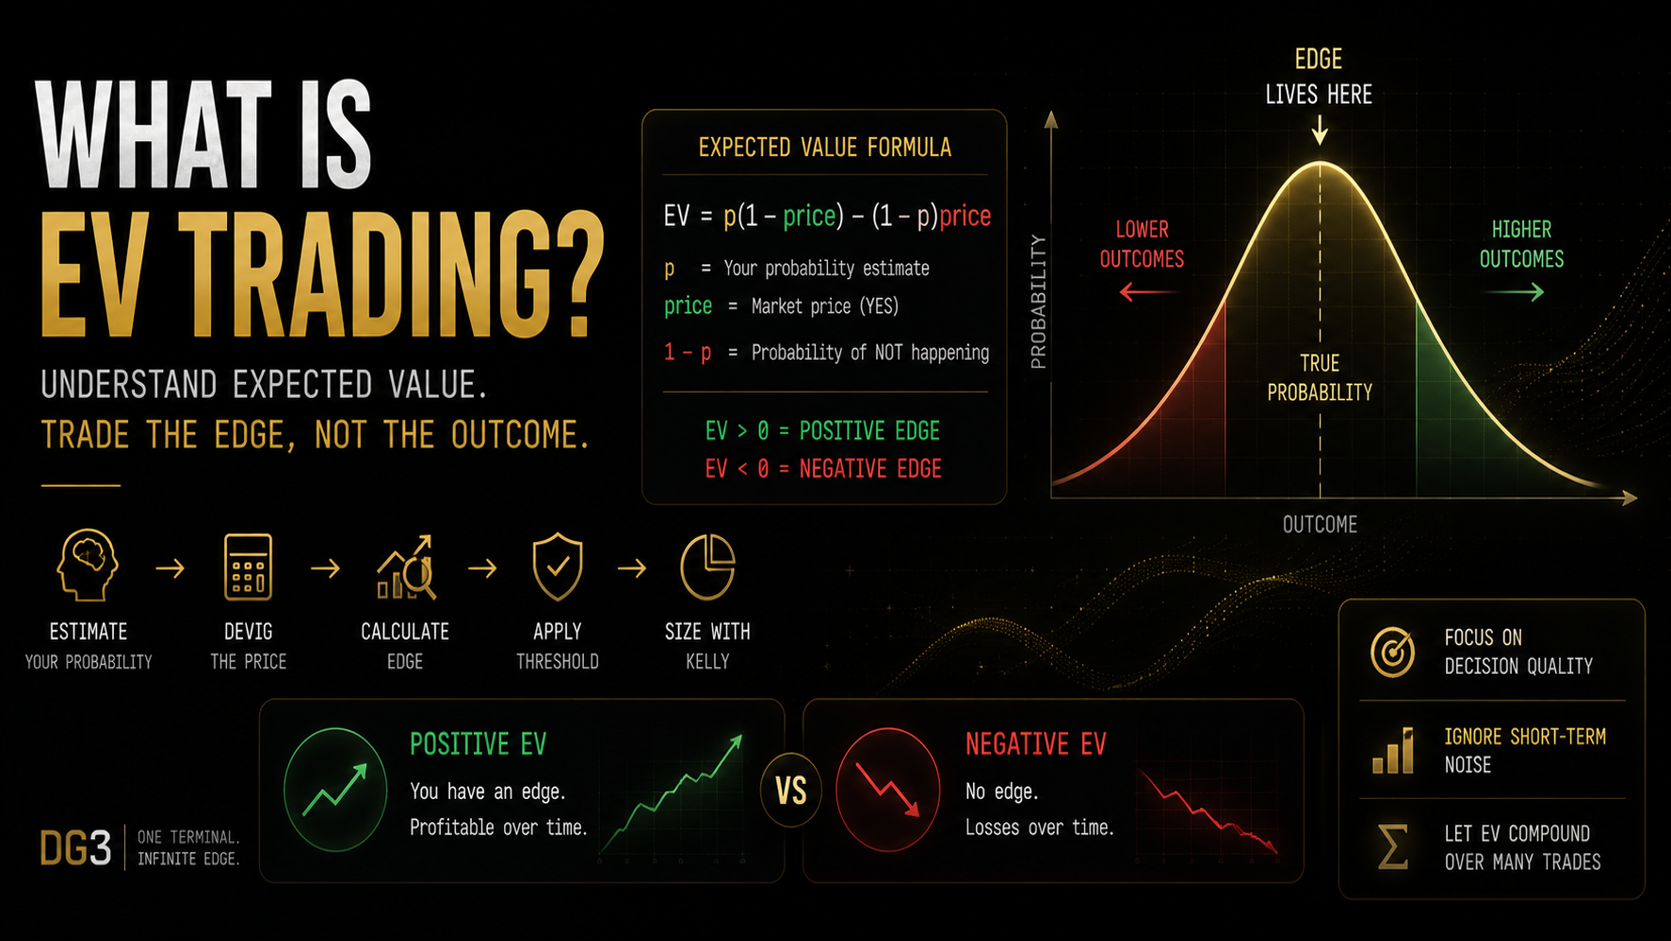
Expected value (EV) in prediction markets is the average result of a position if replayed under identical conditions many times. The formula: EV = (your probability estimate x profit per unit) minus (1 minus your estimate x cost per unit). Positive EV means the average expected outcome is favourable. A single losing result on a positive EV position is not evidence the decision was wrong. It is evidence a probability less than 100% was, on that occasion, the one that happened.
Key Takeaways
- EV is a property of a decision, not an outcome. You can make a correct EV decision and lose. You can make an incorrect EV decision and win. Neither result tells you whether the decision was right. The only standard for evaluating a decision is whether the edge estimate was accurate and the sizing was correct.
- The EV formula requires your probability estimate as an input, not the market price. Using the market price as your estimate produces an EV of approximately zero by definition, because you are using the market’s own consensus to measure edge against the market’s own consensus.
- Negative EV is not just a bad single trade. It is the mathematical direction your results will trend over a large enough sample. A trader who consistently takes negative EV positions on Polymarket will trend toward losses regardless of short-run wins, because the arithmetic compounds in the wrong direction.
- The 2% Polymarket fee on winning positions changes the EV of every trade. A position with zero calculated edge before fees has negative EV after fees. Every EV calculation that ignores the fee structure is slightly wrong, and slightly wrong across 200 positions per year becomes meaningfully wrong.
- Decision quality and outcome quality are different measurements. Poker players have known this for decades. The question after any position is not “did I win?” but “was my probability estimate accurate and did I size it correctly?” Results are not feedback on process quality at small sample sizes.
- DG3’s Fair Value Engine calculates devigged fair probability for every live Polymarket market, giving you the correct market baseline to compare your estimate against, without the manual devig step.
What EV Actually Means: The Coin Before the Formula
Imagine a coin that is weighted 60% heads. You win $1 for heads, lose $1 for tails. You flip it 1,000 times. You will win approximately 600 times and lose approximately 400 times. Net result: +$200. Expected value per flip: +$0.20.
Now flip it 5 times. You could easily get 2 heads and 3 tails. Net result: -$1. Nothing has gone wrong. The coin is still 60% heads. The sample size was too small for the underlying edge to dominate the variance.
Prediction markets work the same way. Replace the coin with a Polymarket market you believe is priced at 0.52 when the true probability is 0.65. That is a 13-cent edge. Over 5 positions at that edge, you might lose 3. Over 200, the arithmetic takes over.
This is the entire concept. The formula below is just that intuition written in numbers.
The EV Formula for Prediction Markets
Expected Value (EV): The average result of a position across many repetitions under the same conditions. Positive EV means the average expected outcome is favourable. Negative EV means it is not. Neither tells you what happens next.
For a YES position on a binary Polymarket market:
EV = (p x (1 – price)) – ((1 – p) x price)
Where p is your estimated probability and price is what you paid per YES share.
[CHART 1 – 5 REAL PREDICTION MARKET EV EXAMPLES]
The formula produces a number in cents per dollar staked. A result of +0.08 means you expect to gain 8 cents for every dollar placed on positions of this type over a large enough sample. A result of -0.04 means you expect to lose 4 cents per dollar. The sign tells you which direction your results should trend. The size tells you how fast.
What the formula requires: a probability estimate that is independent of the market price. If your estimate is the market price plus a gut feeling, you have not used the formula. You have used the market’s consensus plus noise.
Positive EV vs Negative EV: Where Most Traders Actually Sit
Positive EV and negative EV are mathematical categories, not moral ones.
A positive EV position is one where the EV formula produces a number above zero after accounting for Polymarket’s 2% fee on winning positions. Over a large enough sample, results from these positions should trend positive.
A negative EV position produces a number at or below zero after fees. Over a large enough sample, results trend negative. The trader might win individual positions. Variance produces short-run winners from negative EV processes regularly. But the arithmetic works against them at scale.
The honest thing about this: most casual Polymarket traders are neither positive nor negative EV in any consistent way. They have not calculated the EV of their positions at all. They are making decisions that feel right, taking positions they like, and sometimes winning and sometimes losing with no framework to understand why. Some of those positions will happen to be positive EV. Most will sit close to zero EV or slightly negative once the fee structure is applied.
That is not a small problem. A trader consistently operating at zero EV on Polymarket is a trader consistently losing money to fees. They are paying 2% on every winning position with nothing coming back. The fee does not disappear because you did not calculate the EV. It comes out of your balance regardless.
Why Correct EV Decisions Still Lose Money
This is the part that kills systematic approaches before they work.
A 70% probability position loses 30% of the time. That is not a malfunction. It is the expected distribution. Run 10 of these in a row and expect to lose 3. Run them in sequence and you will occasionally see 4 or 5 losses in a row. At that point the process feels wrong. The results look like evidence of a broken system.
The problem is sample size. Ten positions cannot distinguish a 70% edge from a 50% coin flip at any meaningful confidence level. You need approximately 100 positions in a comparable category before the signal starts to surface clearly through the noise. You need 200 before you can draw calibration conclusions with real confidence.
Most retail Polymarket traders never get there. They take 20 positions, experience a losing run, and adjust. They take another 20, experience another losing run, and adjust again. The adjustments feel like improvements. They are not. They are the trail of a strategy being optimized against variance, not against genuine signal.
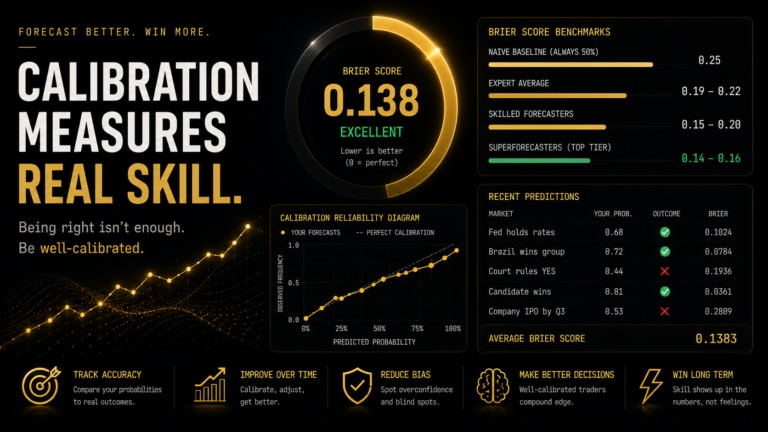
The solution is calibration tracking. Record the probability you estimated before each position, not just the result. After 100 positions, compare your estimated probability bands against your actual win rates. If you estimated 70% on 30 positions and won 19, your calibration is accurate. If you won 14, you are overconfident by approximately 14 percentage points and your EV calculations are systematically overstated by that margin. You can correct that. “I had a bad run” tells you nothing.
For a detailed framework on building and reading your calibration record, the Calibration guide covers this from first principles.
EV Across Different Polymarket Market Types
EV applies identically to every market on Polymarket. The source of edge differs.
Political markets. The crowd prices political markets largely from the same polling data and media narratives. A trader with a better model of turnout dynamics, or one who identifies a systematic polling bias, has a genuine EV edge. A trader who “follows politics closely” and watches the same news as everyone else does not, unless their interpretation of that information is genuinely more accurate than the market’s aggregate.
Sports markets. Edge comes from information timing (acting before injury news is fully priced), domain expertise (understanding what a specific injury actually does to a team’s goal probability, not just the headline), or quantitative model outputs calibrated on historical data. “Knowing football” is not edge. A goals model built on 3 seasons of shot data that outperforms market pricing on over/under lines is edge.
Sports markets. Edge comes from information timing (acting before injury news is fully priced), domain expertise (understanding what a specific injury actually does to a team’s win probability, not just the headline), or quantitative model outputs calibrated on historical data. “Knowing football” is not edge. A goals model built on three seasons of shot data that outperforms market pricing on over/under lines is edge.
In every category the structure is identical: your probability estimate versus the devigged market implied probability. The source of the estimate changes. The math does not. And the fee comes out either way.
Common Mistakes
Mistake 1: Treating a winning trade as evidence of positive EV. You took a position at 0.52 because it felt right and it resolved YES. That result tells you nothing about the EV of the decision. For all you know, the true probability was 0.45 and variance produced a favourable outcome. The only way to evaluate whether a decision was positive EV is to compare your pre-trade probability estimate against the devigged market price at the time of entry not the outcome.
Mistake 2: Calculating EV before devigging the market price. The raw Polymarket YES price is not the market’s implied probability. It includes the bid-ask spread, which inflates the number by 1-3%. Comparing your estimate against the raw price produces edge calculations that are systematically wrong in a way that makes edges look slightly larger than they are. Devig first: fair probability = YES / (YES + NO). The Implied Probability Calculator article explains this in full.
Mistake 3: Confusing a directional view with a probability estimate. “I think the Fed will hold rates” is a directional view. “I estimate a 73% probability the Fed holds rates, versus the devigged market implied 59.8%” is an EV calculation. The difference is quantification. Without a number, there is no edge to calculate. You cannot do EV trading without forming a specific probability estimate. Directional conviction that has never been quantified is not positive EV thinking. It is positive sentiment about an outcome.
Mistake 4: Abandoning the framework after a losing streak. If your calibration tracking shows genuine positive EV over 50+ positions in a category, a losing week is not evidence the framework is broken. It is evidence variance is doing what variance does on small samples. The mistake is interpreting short-run results as feedback on process quality. They are not. Calibration data over 100+ positions is feedback. Last week’s results are noise.
Mistake 5: Ignoring the fee when evaluating apparent edges. Polymarket’s 2% fee on winning positions changes the EV sign on small edges. A 1-cent apparent edge at a 0.55 market costs approximately 0.9 cents in fees on a winning position, making the net EV approximately 0.1 cents barely worth the execution friction. Before acting on any small edge, calculate the fee cost precisely and check whether the net position clears a meaningful threshold.
The Arithmetic Without the Manual Work
The manual version of EV calculation for a single position (fetch prices, devig, compare estimate, calculate edge, check threshold) takes 3-5 minutes. Applied to a watchlist of 30 active Polymarket markets, that is 90-150 minutes before you have screened a single day’s opportunity set.
DG3’s Fair Value Engine deviggs every live Polymarket market automatically, producing the correct fair probability in real time. You arrive at the edge calculation step without the manual arithmetic.
DG3’s Edge Finder then ranks all live markets by divergence from fair value, updated continuously. Markets with the largest current gaps sit at the top of the ranked list. Your probability estimate in Step 1 is still the work that creates the edge. DG3 handles everything between that estimate and knowing which markets are worth bringing it to right now.
Access the terminal at dg3.trade.
Frequently Asked Questions
Q: What does EV mean in prediction markets? A: EV stands for expected value. It is the average result of a position if replayed under identical conditions many times. A positive EV position has a mathematically favourable expected average outcome. EV is a property of the decision, not the result of a specific trade. One loss on a positive EV position tells you nothing about whether the decision was correct.
Q: What is positive vs negative EV in prediction market trading? A: A positive EV position is one where your devigged edge calculation produces a number above zero after Polymarket’s 2% fee on winning positions. A negative EV position produces a number at or below zero. Over a large enough sample, positive EV positions trend toward profits and negative EV positions trend toward losses, regardless of short-run results.
Q: How do you calculate EV in a prediction market trade? A: EV = (your probability estimate x profit per unit) minus ((1 minus your estimate) x cost per unit). For a YES position at 0.55 where you estimate 70% probability: EV = (0.70 x 0.45) minus (0.30 x 0.55) = 0.315 minus 0.165 = +0.15 per dollar staked. Devig the market price first: divide YES by (YES + NO) before comparing.
Q: Is EV trading profitable in prediction markets? A: Systematically applying EV-based decision-making across a large sample of positions with genuine edge produces positive expected returns. The requirement is that the edge must be real (your probability estimates must be better calibrated than the market’s over time) and the sample size must be large enough for the math to dominate variance. Traders who apply the framework with accurate estimates and consistent sizing will trend positive across 100 or more comparable positions.
Q: Why can you make correct EV decisions and still lose money? A: Because probability is not certainty. A 70% position loses 30% of the time by design. Over small samples 10, 20, 30 positions variance dominates and results tell you nothing reliable about whether the underlying decisions were positive EV. Over 100 or more comparable positions, the law of large numbers starts to make the underlying EV legible in the results. This is why abandoning a systematic approach after a losing streak is the most expensive mistake in prediction market trading.
Q: How does DG3 display EV per market? A: DG3’s Fair Value Engine calculates the devigged fair probability for every live Polymarket market. DG3’s Edge Finder then shows the gap between that fair probability and the current market price. Markets with the largest gaps between fair value and trading price appear at the top of the ranked list. That divergence is the same calculation this article describes as edge.
Q: What is the difference between EV and profit in prediction markets? A: EV is the expected average result of a decision process applied over many repetitions. Profit is what actually occurred on specific positions in a specific period. They diverge significantly in the short run due to variance and converge over large samples. A trader with positive EV and negative short-run profit is experiencing variance. A trader with negative EV and positive short-run profit is experiencing luck. EV measures whether you are playing the right game.
Q: What is the expected value formula for prediction markets? A: For a binary YES position: EV = (p x (1 minus price)) minus ((1 minus p) x price). Where p is your estimated probability and price is the YES price you are paying. This gives EV in cents per dollar staked. A positive result means the position has positive expected value before fees. Subtract Polymarket’s 2% fee from the profit side for the net EV.
Q: How do I know if my prediction market trades are actually positive EV? A: Track the probability you estimated before each position, not just the result. After 100 comparable positions, compare your estimated probability bands against your actual win rates. If you estimated 70% on a group of positions and won 69% of them, your estimates are well-calibrated and the EV calculation was likely accurate. If you won 55%, you were overconfident by 15 percentage points and your EV calculations were consistently overstated by that margin.
Final Thoughts
EV is not a trading style. It is the only mathematically coherent framework for evaluating prediction market decisions.
Every position you take has an EV, whether you calculate it or not. The question is whether you are taking positions with positive EV, negative EV, or EV you have never bothered to measure. Most retail traders on Polymarket are in the third category. They are making decisions that feel right without any quantitative basis for that belief. Some of those positions happen to be positive EV. Many are slightly negative once the fee structure is applied. The trader never knows which is which.
The formula takes 30 seconds. The habit of applying it before every position, in the correct sequence, takes months to build. The discipline of staying systematic when results do not cooperate takes longer.
Start with the formula. Everything else follows from there.
Read the full practical framework for applying this at Positive EV Trading: A Practical Framework.
Sign up now – DG3 Terminal
Also read:
Positive EV Trading: A Practical Framework for Prediction Markets
Calibration in Prediction Markets: How to Measure Forecast Accuracy
Kelly Criterion for Prediction Markets: Sizing Positions When Odds Move