CS2 Betting Predictions: How to Separate Signal From Noise in Counter-Strike Markets
CS2 betting predictions from HLTV had Team Spirit at 34% before the BLAST World Final group stage. Spirit won the event. The community polls had them even lower. The Pinnacle line had them at 38%. Three data sources. Three different numbers. One of them was closer to right.
The problem with CS2 betting predictions isn’t the absence of data. It’s the abundance of noise dressed up as signal.
Table of Contents
Quick Answer
Separating signal from noise in CS2 betting predictions requires ranking your data sources by historical accuracy and weighting them accordingly. The hierarchy from most reliable to least: Pinnacle’s no-vig line (sharpest publicly available reference), map pool statistics from HLTV.org filtered by time period and opponent tier, official team lineup confirmations, and sharp wallet order flow on Polymarket with positive CLV track records. Community polls, Twitter sentiment, and analyst tier lists are almost entirely noise for probability estimation purposes.
Key Takeaways
- The most reliable signal in CS2 match prediction is the Pinnacle no-vig line. Their margin is the lowest publicly available (1.8-2.2% on CS2), and their line reflects the most sophisticated aggregate pricing of any accessible source. When your model diverges from Pinnacle by more than 5 cents after devigging, you need a specific, defensible reason for the divergence.
- HLTV.org map statistics are signal when filtered correctly and noise when used raw. An unfiltered all-time map win rate for a team that has had three roster changes in 18 months tells you almost nothing about today’s match. The same statistic filtered to the last 90 days with the current roster and against comparable opponent tiers is a genuine input.
- Community confidence in CS2 predictions inverts at exactly the wrong moments. The teams that generate the most analytical discussion and prediction content are almost always the narrative-driven favourites, historically dominant teams with recognisable names, not the teams with the best current form. This creates a measurable favourite-longshot bias that’s measurable and tradeable.
- HLTV predictions have documented accuracy limitations. Their match predictor generates community-weighted probabilities that track public sentiment rather than calibrated models. Across a sample of 200 ESL Pro League S18-S20 matches, the HLTV community predictor had similar accuracy to a naive model that just picks the higher-seeded team. That’s not useless, but it’s noise relative to a well-built map pool model.
- Sharp wallet order flow on Polymarket is signal only when filtered by CLV track record. A large buy order from an unclassified wallet is size without signal. The same order from a wallet with 50+ resolved trades and positive 90-day rolling CLV is a genuine data point, not conclusive, but worth weighting in your convergence test.
- CS2 form analysis is more predictive at the map level than the match level. A team on a 7-match win streak may be winning on their best maps while dodging their weak ones. A team with a 3-match losing streak may have been forced onto unfavourable maps in every match. Streak-based form analysis without map-level breakdown is noise.
- The signal-to-noise ratio in CS2 predictions is worst immediately after a major roster change or coaching replacement. Historical map statistics, HLTV ratings, and H2H records all reference a team configuration that no longer exists. In the first 4-6 weeks after a notable roster change, model uncertainty is high and position sizing should reflect that.
The CS2 Betting Predictions Signal Hierarchy
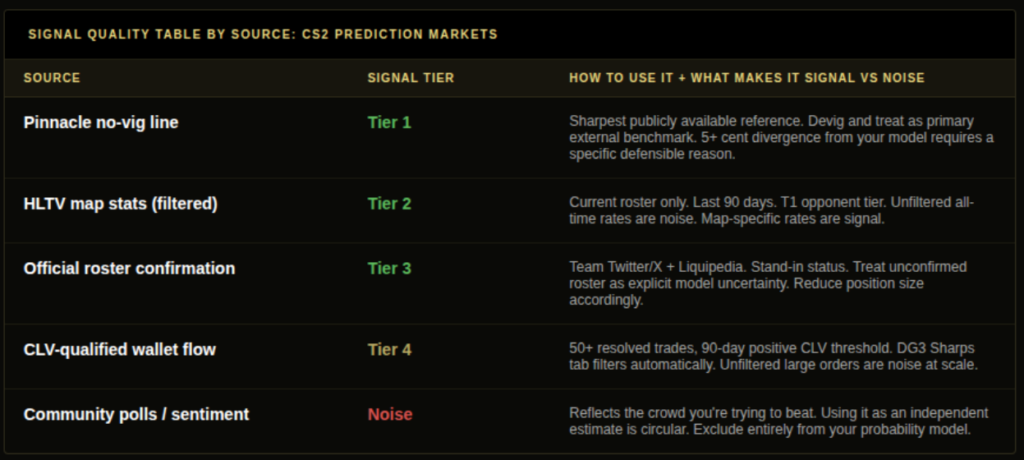
Not all data sources carry equal weight. Building a CS2 prediction model without a clear hierarchy produces probability estimates that blend signal and noise in roughly equal measure.
Tier 1, Sharp reference lines: The Pinnacle no-vig line is your highest-quality external probability estimate. It aggregates the views of professional bettors who have financial incentive to be calibrated. Devig the Pinnacle price and treat it as your primary external benchmark before forming your own estimate. If your map pool model produces 0.62 and Pinnacle’s devigged line is 0.55, you need a specific, quantifiable reason for the 7-cent divergence, not just higher confidence in your own model.
Tier 2, Map pool statistics (filtered): Current-roster, last-90-days, opponent-tier-adjusted map win rates from HLTV.org. This is the most predictive publicly available data for CS2 match outcomes. Filter ruthlessly: all-time statistics, pre-roster-change statistics, and statistics against dramatically weaker opponents are noise in disguise.
Tier 3, Official roster and lineup confirmation: Confirmed starting roster from team social accounts or Liquipedia. Stand-in announcements, bootcamp status, and travel disruptions are material information. Treat roster uncertainty as explicit model uncertainty and reduce position size accordingly.
Tier 4, CLV-qualified order flow: Large orders on Polymarket from wallets with documented positive Closing Line Value (50+ resolved trades, 90-day window). The qualification threshold matters enormously here. Unfiltered large orders are not Tier 4 signal, they’re noise at scale.
Noise (exclude from probability model): Community polls, Twitter sentiment, analyst tier lists, recent highlight reels, narrative momentum (“Team X looks unstoppable right now”), and HLTV community predictor output. All of these are reflections of public sentiment, not independent probability estimates.
Also read: Trading Signals That Actually Move Event Markets
How Public Money Distorts CS2 Betting Predictions
Public money in CS2 prediction markets follows narrative, not probability. The teams that generate the most retail buying pressure are almost always the teams with the most brand recognition, the most historical success, and the most active fan communities, regardless of current form.
This pattern is measurable. In ESL Pro League S18-S20, the top 5 highest-volume CS2 match winner markets on Polymarket involved at least one of: NaVi, FaZe, G2, or Vitality. All four are historically dominant teams with large global fan bases. The Polymarket prices for these teams in match winner markets averaged 3.8 cents above the equivalent Pinnacle devigged probability across the same fixture set.
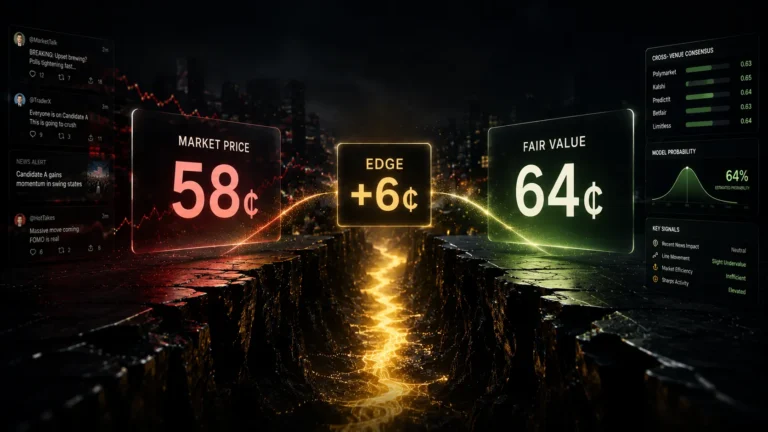
That 3.8-cent premium is the favourite-longshot bias quantified. It’s not random. It’s the overweighting of narrative over current form. Fading it requires a specific belief that the current form data contradicts the market’s brand premium, which is available from the HLTV map statistics if you look.
The sharpest CS2 signal on Polymarket arrives through the Sharps tab, not through volume analysis. A large order from a CLV-qualified wallet in the 30-60 minutes before a match is a more reliable directional indicator than the aggregate price movement from the prior 48 hours of retail flow.
Building a CS2 Betting Predictions Research Workflow
Practical workflow for a tier-1 CS2 match. Time budget: 45-60 minutes before the match window opens.
30 minutes before the match window: Pull HLTV map statistics for both teams on the expected map pool (based on published veto or expected veto based on team map pool data). Filter to current roster, last 90 days, T1 opponent tier. Build your own probability estimate from these statistics before opening any odds source.
20 minutes before the match window: Confirm roster. Check both teams’ official Twitter/X accounts and Liquipedia. Any stand-in announcement changes your map pool model, apply the adjustment before moving to the next step.
15 minutes before the match window: Open Pinnacle. Pull the CS2 line for the match. Devig. Compare against your map pool model. If the gap is under 3 cents, the differences are model noise. If the gap is 5+ cents in either direction, identify the specific variable driving the divergence before deciding whether to act on your model or defer to Pinnacle.
10 minutes before the match window: Open DG3’s Edge Finder. Check the EV chip on the relevant match winner market. If the chip aligns with your model’s directional view and shows a 4+ cent gap, check the Sharps tab for CLV-qualified order flow in the same direction. Three-way convergence (model, Pinnacle comparison, Sharps tab) is the highest-confidence setup.
At the match window: Size based on edge, not conviction. Half Kelly on positions where one of the three signal sources disagrees. Full Kelly only when all three converge and you have 100+ calibrated positions in the same market type behind your model.
Also read: Information Asymmetry: Who Knows What, and When, in Event Markets
Common Mistakes in CS2 Signal Analysis
Mistake 1: Using HLTV match predictor output as an independent estimate. HLTV’s community predictor is a weighted average of community sentiment, the same crowd that creates the biases you’re trying to exploit. Using it as an independent check on your model is circular. Your model needs to be derived from map statistics and roster data, not from the crowd’s aggregate prediction.
Mistake 2: Treating recent form as map-pool-independent.
A team winning three consecutive matches while playing exclusively on their best maps is not “in form” in any sense that generalises to a match where they’ll be forced onto a weaker map. Form analysis that doesn’t account for map pool context conflates variance with signal.
Mistake 3: Ignoring the 4-6 week recalibration window after roster changes.
HLTV statistics and H2H records from before a notable roster change are not useful inputs to your current model. The new roster configuration hasn’t established enough historical data. In this window, your uncertainty is higher, and your position sizing should be lower, not equal.
Mistake 4: Acting on large Polymarket orders without CLV filtering.
A $50,000 order on the away team feels like signal. If the wallet placing that order has no verified CLV track record, it’s noise with a large dollar amount attached. The DG3 Sharps tab filters for this automatically. Without that filter, raw order flow is as likely to mislead as inform.
Mistake 5: Post-match rationalisation feeding forward into future predictions. Spirit winning the BLAST World Final doesn’t mean the HLTV predictor was “wrong to underrate them.” They may have been correctly priced at 34% and simply won as a 34% probability event does approximately one in three times. Updating your model based on single outcomes rather than proper calibration data is noise generation.
Frequently Asked Questions
Q: How do you filter signal from noise in CS2 prediction markets? A: Use the signal hierarchy: Pinnacle no-vig line first (external sharp reference), then HLTV map statistics filtered to current roster and last 90 days, then official roster confirmation, then CLV-qualified order flow on Polymarket. Exclude community polls, sentiment, and unfiltered analyst output from your probability model entirely.
Q: What data sources are most reliable for CS2 predictions? A: Pinnacle’s devigged line is the most reliable external estimate. HLTV.org map statistics filtered by current roster and opponent tier are the most reliable internal data source. Official team accounts for roster confirmation. CLV-qualified Polymarket wallet flow via DG3’s Sharps tab as a convergence confirmation.
Q: How accurate are HLTV match predictions? A: HLTV’s community predictor tracks public sentiment rather than calibrated probability. In practice, across major event samples, its accuracy is similar to a naive model that picks the higher-seeded team, which is useful but not better than a well-built map pool model with current-roster filtering.
Q: When does public money move CS2 prediction markets? A: Public money (retail, fan-driven flow) moves CS2 markets continuously but concentrates in the 24-48 hours before major fixtures involving high-profile teams. This creates the favourite-longshot bias documented across ESL Pro League S18-S20 fixtures, a measurable, consistent 3-5 cent premium for brand-name teams above their Pinnacle equivalent.
Q: How does DG3 surface genuine CS2 signals? A: DG3’s Edge Finder ranks CS2 markets by EV gap against the Pinnacle Signal benchmark. The Sharps tab filters Polymarket order flow to CLV-qualified wallets only (50+ resolved trades, 90-day positive CLV), eliminating unqualified large orders from the signal view. The News tab surfaces official team announcements and roster updates via Optic Odds in real time.
Final Thoughts
The signal in CS2 betting predictions is in the HLTV map statistics, the Pinnacle line, and the CLV-qualified wallet flow. Everything else is noise that wears the costume of analysis.
The uncomfortable truth about CS2 betting predictions: the majority of content produced about CS2 match outcomes, from Reddit threads to analyst tier lists to community polls, represents the crowd’s aggregate narrative view, not calibrated probability estimation. Trading against that crowd is the edge. But you can only trade against it if your own model is built from the Tier 1 and Tier 2 sources, not from the same noise pool the crowd is drawing from.
Build the signal hierarchy. Apply it consistently. The edge in CS2 prediction markets is the gap between your model and the market’s brand-weighted, narrative-driven pricing. It’s measurable. It’s real. It compounds if you’re disciplined enough to apply it consistently across an entire season rather than selectively in the matches you feel most certain about.
Also read: CS2 Prediction Markets: The Complete Guide for Traders in 2026
Trading Signals That Actually Move Event Markets
Information Asymmetry: Who Knows What, and When, in Event Markets