

How to Find Mispriced Markets on Polymarket
Every time you open Polymarket there are between 200 and 500 active markets. A handful of them, at any given moment, are mispriced. The gap between the current price and the honest probability is wide enough to generate positive EV after fees.
The problem isn’t that the mispricings don’t exist.
It’s that finding them manually, across 500 markets, each requiring a devig calculation and a probability comparison, takes longer than most mispricings last.
Table of Contents
Quick Answer
Mispricings exist on Polymarket right now.
Finding mispriced markets on Polymarket requires three steps: devig the current price to get the fair value benchmark, compare that benchmark against your independent probability estimate, and confirm the gap is large enough to exceed the 2% platform fee. Mispricings are most common in markets with thin liquidity, immediately following breaking news before the crowd has fully processed it, and in market categories where fewer participants have genuine domain expertise.
Key Takeaways
- A mispriced market isn’t one where the price is wrong. It’s one where the price is wrong relative to a specific participant’s probability estimate, in a way that creates positive expected value at the current price. The mispricing is relative to your model, not objective.
- The three structural sources of persistent mispricing on Polymarket are: thin liquidity (fewer participants means slower price discovery), news lag (breaking information takes time to fully absorb into the aggregate), and crowd bias (systematic overweighting of narratives, favorites, and salient teams).
- Devigging is not optional. Comparing your probability estimate against the raw Polymarket price inflates your apparent edge by approximately 2% and causes you to overstate how mispriced the market is. Every edge calculation should use the devigged fair value, not the raw price.
- The minimum viable edge on Polymarket after the 2% market order fee is approximately 3-4 cents at mid-price ranges (0.40-0.60). Below this threshold, the fee consumes the mathematical edge and the trade has negative expected value in aggregate.
- Mispricing windows close. On liquid markets with $500,000+ in trading volume, a mispricing that is visible to one participant with a good model will typically be visible to others. The window between mispricing appearance and correction can be 5-20 minutes on liquid markets. On thin markets, it can be hours.
- The most consistently exploitable mispricings on Polymarket are not in the most popular markets. They are in the less-watched market categories, total goals, group stage qualification, player award markets, where the analytical depth of the participant pool is shallower and the speed of price correction is slower.
- Manual scanning across 500 markets is impractical. Systematic edge detection needs either a pipeline you build yourself or a terminal that’s already built it. Most traders use neither. The time to manually devig 10 markets is often longer than the mispricing window on any one of them.
What Makes a Prediction Market Mispriced
Market mispricing: A condition where the devigged fair value of a prediction market contract differs meaningfully from the true probability of the outcome, as assessed by a participant with a calibrated probability model.
Not every price gap is a mispricing.
Most aren’t. A market that says 0.42 when you estimate 0.45 might simply reflect honest disagreement between your model and the aggregate market, neither one necessarily wrong. A market that says 0.42 when your model has 0.58, your reference sportsbook has 0.54, and two CLV-qualified wallets entered YES in the last 20 minutes is a convergent mispricing signal.
Three structural sources. All confirmed by watching Polymarket price real events:
Thin liquidity markets: Fewer participants, slower price discovery. A market with $20,000 in total volume has a smaller information aggregation pool than one with $2,000,000. Thin markets stay mispriced longer but support smaller position sizes before market impact erodes the edge.
Breaking news lag: When a team sheet drops, an injury is confirmed, or a major development breaks, the market begins repricing immediately but does not reach the new equilibrium instantly. In the 5-30 minute window following a material development, the current price often does not fully reflect what the information implies for the outcome probability. A participant with a faster or more accurate interpretation of the news has a window to enter before the market catches up.
Crowd bias: Systematic patterns in how the prediction market crowd prices outcomes. Favourite-longshot bias is documented across Polymarket. Pre-tournament, France’s outright winner price typically sits 2-4 cents above the Pinnacle no-vig equivalent because the crowd backs narratives, not probabilities. Narrative bias, overweighting teams or outcomes with a compelling story, is equally common. Both create persistent, if modest, mispricings in specific market types.
Also read: Market Efficiency in Prediction Markets: Are They Really Smarter Than the Crowd?
How to Find Mispriced Markets on Polymarket: The 5-Step Process
The 5-step process for identifying mispriced markets on Polymarket works for any market type, any sport, any time horizon.
Step 1: Scan for Markets with Meaningful EV Gaps
Manual scanning is impractical at scale. The starting point should be a pre-filtered view of markets ranked by the gap between current price and fair value. DG3’s Edge Finder does this continuously across all active Polymarket markets, the EV ranking shows which markets have the largest divergence between price and the Signal no-vig benchmark (Pinnacle’s devigged line, where available) at any given moment.
Without a tool, a manual starting filter: sort Polymarket markets by volume, then look at markets with moderate volume ($50,000-$500,000) where the current price shows an unusual distribution relative to prior days. Markets that have moved more than 8 cents without obvious news are worth examining.
Step 2: Devig the Current Price
For any market worth examining, devig the price before proceeding. On a binary YES/NO market:
Devigged YES = raw YES / (raw YES + raw NO) Devigged NO = raw NO / (raw YES + raw NO)
Example: YES priced at 0.58, NO priced at 0.46. Sum = 1.04. Devigged YES = 0.58 / 1.04 = 0.557 Devigged NO = 0.46 / 1.04 = 0.443
The devigged values sum to 1.00 and represent the honest market-implied probabilities.
Also read: Implied Probability Calculator: Read Prediction Market Prices as Probabilities
Step 3: Form Your Independent Probability Estimate
Do not look at the current price when forming your estimate. The price anchors your thinking. Form the estimate from your model, your domain knowledge, and available external references (reference sportsbook lines, publicly available statistical data) before comparing.
Write the number down. Then compare.
Step 4: Compare and Calculate Edge
Edge = your probability estimate – devigged fair value
If your estimate is 0.68 and the devigged fair value is 0.557, your edge is 12.3 cents. After the approximately 2% market order fee (approximately 2 cents at this price level), net edge is approximately 10 cents. This is sufficient edge to proceed to sizing.
If your estimate is 0.60 and the devigged fair value is 0.557, your edge is 4.3 cents. After the 2% fee, net edge is approximately 2 cents. This is below the practical minimum threshold for most positions. Pass.
Step 5: Apply the Convergence Test
An isolated positive edge calculation is a reason to investigate. Multiple independent signals pointing in the same direction is a reason to act.
Before entering, check: does the reference sportsbook line agree with your directional assessment? Has a CLV-qualified wallet recently entered in the same direction? Is there a recent news event that explains the mispricing, and if so, has the market fully absorbed it yet?
When your model, the reference book, and the order flow all point in the same direction, the probability that you are misreading the situation is lower than when your model alone is the source.
Also read: Edge Decay in Prediction Markets: Why Alpha Disappears
Edge Threshold by Market Type
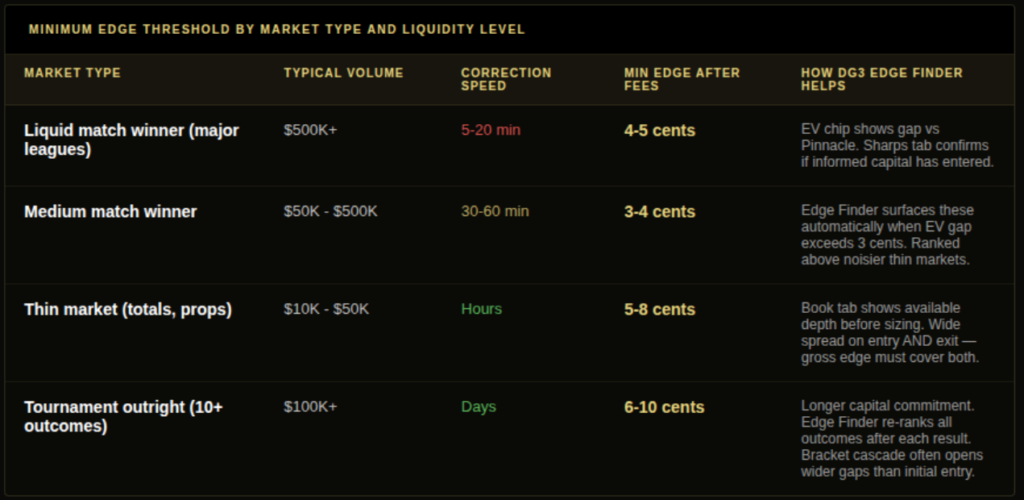
The minimum viable edge varies by market characteristics. The 2% fee applies to all market orders. Position size and market impact determine the practical floor.
Liquid markets ($500K+ volume, tight spread): Minimum edge: 4-5 cents after fees. These markets are watched by more participants and correct faster. A 2-cent edge after fees is likely within the noise of model error at this depth.
Medium markets ($50K-$500K volume, moderate spread): Minimum edge: 3-4 cents after fees. Slightly more persistent mispricings, moderate market impact on standard position sizes.
Thin markets ($10K-$50K volume, wide spread): Minimum edge: 5-8 cents after fees. The wider spread on entry and exit increases the effective cost. A larger gross edge is required to produce the same net edge after all costs.
Outrights (10-32 outcomes, long duration): Minimum edge: 6-10 cents after fees. Longer capital commitment requires higher edge threshold to justify the opportunity cost.
Finding Mispriced Markets Before the Window Closes
The practical problem with mispricing detection is that the best opportunities exist in a time window that varies from 5 minutes (liquid market, breaking news) to several days (thin market, slow information absorption).
For breaking-news-driven mispricings, the requirement is: a pre-formed probability estimate for the affected market (before the news, not in reaction to it), and fast access to the affected market’s current price and order book. A trader who has already estimated that a specific player’s absence reduces their team’s win probability by 12 percentage points, and has done that work in advance, can act in the first 3-5 minutes of the mispricing window rather than spending those minutes on research.
For structural mispricings in thin markets, the time pressure is lower. A market with $30,000 in volume where crowd bias has created a 15-cent gap between your estimate and the devigged price may persist for hours. The constraint is position size (thin book means limited fill before market impact erodes the edge) rather than time.
The Edge Finder addresses the detection side of this: markets ranked by EV gap in real time surface the largest current divergences across all active Polymarket markets without requiring manual scanning of each one.
Finding Mispriced Markets Faster With DG3
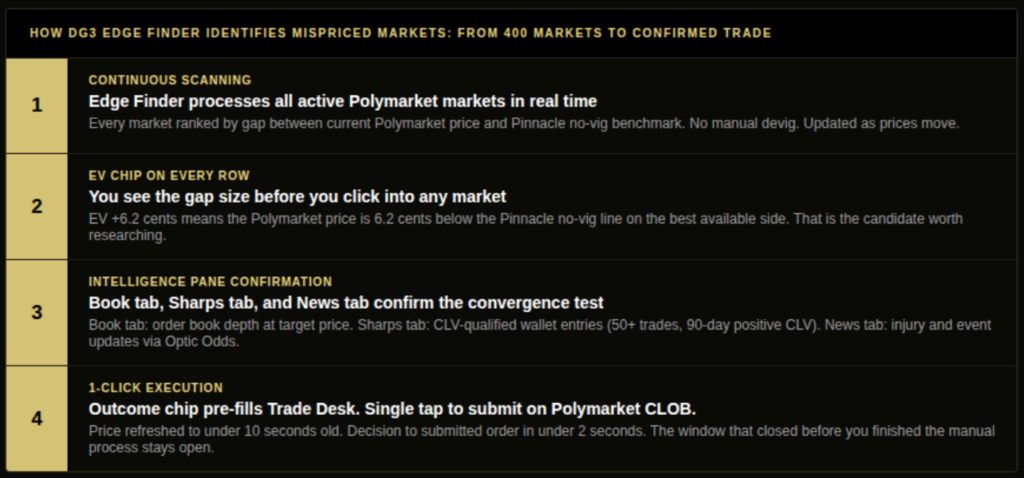
Manual scanning across 400 active Polymarket markets is how most traders find mispricings. You open a market, devig the price, compare it against your estimate, check the reference book, move to the next one. By the time you have gone through 10 markets, the window on the first one is often gone.
DG3’s Edge Finder does the scanning continuously.
Every active Polymarket market is ranked by the gap between the current price and the Pinnacle no-vig line, updated in real time. You open DG3 and see which markets have the largest EV gap right now, without touching a single devig calculator.
The EV chip on each market row shows the gap in cents. Markets with a 7-cent gap sit above markets with a 2-cent gap. The ranking updates as prices move, so when a team sheet drops and a match winner market shifts 9 cents, that market rises to the top of the list before most traders have processed the news.
When you find a candidate, the Intelligence pane opens alongside it. The Book tab shows live Polymarket order book depth at the current price, so you can check whether there is enough liquidity to fill your intended position size before the gap closes. The Sharps tab shows whether CLV-qualified wallets have entered in the same direction as your model, which is the convergence test this guide describes.
The 5-step process in this article stays exactly the same: form your probability estimate independently, devig the price, calculate edge, apply the convergence test, execute if it passes. DG3 compresses steps 1 and 2 by doing the scanning and devigging before you arrive at the market. The judgment, the probability estimate, the decision.
Still yours.
Also read: The Gap Closes Before Most Traders See It
Common Mistakes
Mistake 1: Comparing your estimate against the raw price, not the devigged value. The raw Polymarket price includes the platform’s implied margin. On a binary market, this inflates the apparent edge by approximately 2%. Using the raw price makes every position look 2 cents better than it actually is. This is enough to turn a fee-threshold position into an apparent bargain, and an apparent bargain into an edge calculation that is larger than reality.
Mistake 2: Acting on edge without confirming market liquidity. An 8-cent edge in a $12,000 volume market sounds good until you check the order book and find 150 shares available at the current price. A $300 buy order clears the book and your average fill is 3 cents worse than the displayed price. The edge you calculated assumed filling at the current price. The actual fill produced a very different edge.
Mistake 3: Treating every price gap as a mispricing. A market can show a gap between your estimate and the devigged price for multiple reasons: your estimate is wrong, the market has information you do not have, or there is genuine honest disagreement. Not every gap is a mispricing. The convergence test, external reference book agreement, CLV-qualified order flow in the same direction, is what separates probable mispricing from honest disagreement.
Mistake 4: Missing the edge by acting too late. A mispricing is identified, the edge is calculated, the convergence test passes. Then 12 minutes pass while the analysis is completed and the order is built. The market has partially corrected. The entry price is 4 cents worse than calculated. The net edge after fees is below the viable threshold. The correct response to a confirmed mispricing is fast execution, not continued refinement of the analysis.
Mistake 5: Ignoring the fee in the edge calculation. A 2-cent edge looks like profit. After the approximately 2% market order fee at a 0.50 price level, it is break-even at best and slightly negative in expectation. Always calculate edge after fees, not before. The fee is not optional and not marginal, it is real and it compounds across every trade.
Frequently Asked Questions
Q: What makes a prediction market mispriced? A: A gap between the devigged fair value and a participant’s calibrated probability estimate that is large enough to generate positive expected value after the platform fee. Structural sources include thin liquidity, news-driven lag before full absorption, and systematic crowd bias patterns.
Q: How do you find mispriced markets on Polymarket? A: Systematically: devig the current price, compare against an independently formed probability estimate, check the reference sportsbook for external validation, and apply the convergence test (order flow, reference book, model all pointing the same direction). At scale: use a tool that ranks markets by EV gap continuously rather than checking each market manually.
Q: What tools help identify mispriced prediction markets? A: DG3’s Edge Finder ranks all active Polymarket markets by the gap between current price and fair value in real time. The Polymarket CLOB and Gamma APIs provide raw data for building your own processing layer. Sharp sportsbook comparison (Pinnacle devigged line) provides an independent external benchmark.
Q: How does DG3 rank markets by mispricing? A: The Fair Value Engine devigs live Polymarket prices and compares them against the Signal no-vig benchmark (sourced from Pinnacle via OpticOdds where available). The gap between the current market price and the fair value is the EV chip shown on each market in the Edge Finder. Markets are ranked by this gap in real time, showing the largest current divergences at the top of the ranked list.
Q: How long does a mispriced market stay mispriced? A: Varies meaningfully by liquidity and information type. On liquid markets ($500K+ volume) following breaking news, the correction typically takes 5-20 minutes. On thin markets ($20K-$50K volume) with structural crowd bias, a mispricing can persist for hours or days. The Edge Decay guide covers exactly how decay speed varies by market type and catalyst type.
Q: What is the minimum edge to enter a mispriced Polymarket position? A: After the 2% market order fee, the practical minimum is 3-4 cents at mid-price ranges. Below this, the fee consumes the mathematical edge. On thin markets with wider spreads, the effective minimum is higher because entry and exit both incur spread costs in addition to the fee.
Final Thoughts
The mispriced markets are there. On Polymarket, right now, while you read this.
Some of them. They’re not obvious, they don’t last long in liquid categories, and they require a systematic process to find consistently.
Not accidentally.
The uncomfortable truth is that most Polymarket participants do not find mispricings. They pick directions based on narratives, back obvious favorites, and react to news after the market has already absorbed it. That is not a criticism, it describes 90% of participants in every two-sided market in history.
The remaining 10% who find and act on genuine mispricings consistently are not smarter. They don’t have better models in every case. They have a systematic process, a calibration record that validates it, and the infrastructure to execute before the window closes.
Build the process.
The mispricings will be visible. They always were.
Also read:
Market Efficiency in Prediction Markets: Are They Really Smarter Than the Crowd?
Positive EV Trading: A Practical Framework for Prediction Markets
Edge Decay in Prediction Markets: Why Alpha Disappears
Devigging 101